Question: Microsoft Excel Activity #1: Chase Production Strategy 0 X Question 1 0/10 Video Submit Excel Online Structured Activity: Chase Production Strategy The ATV Corporation makes
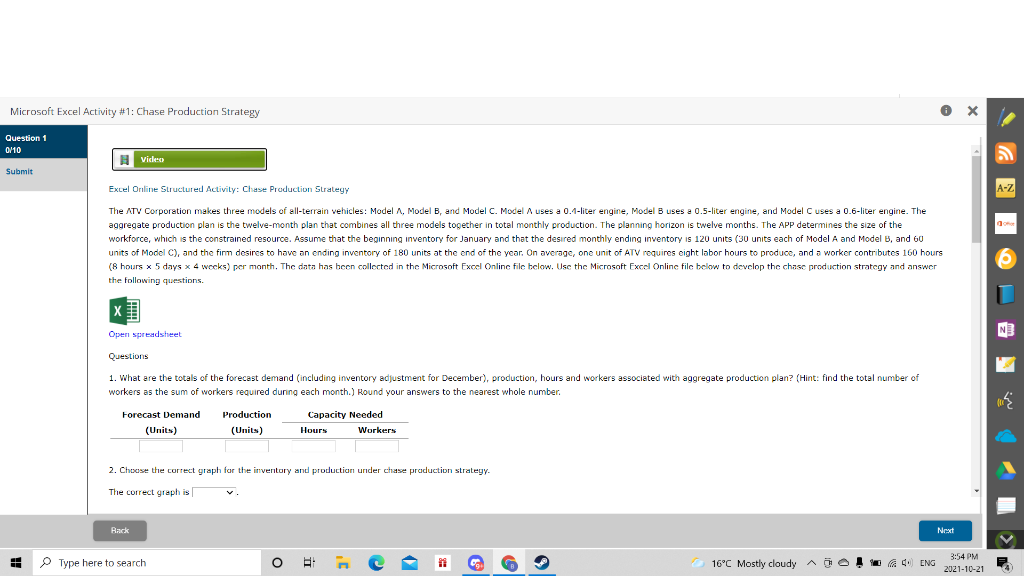
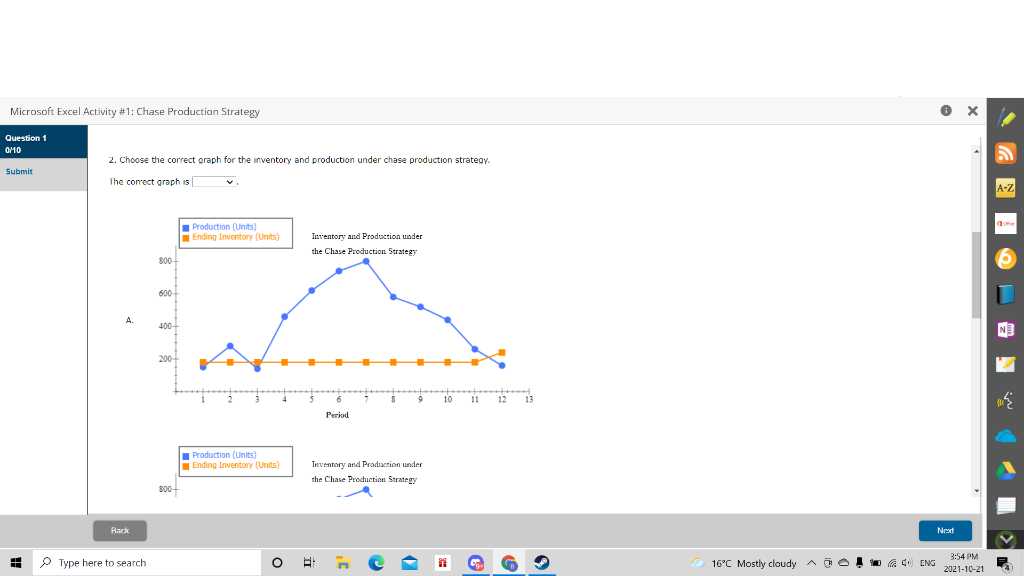
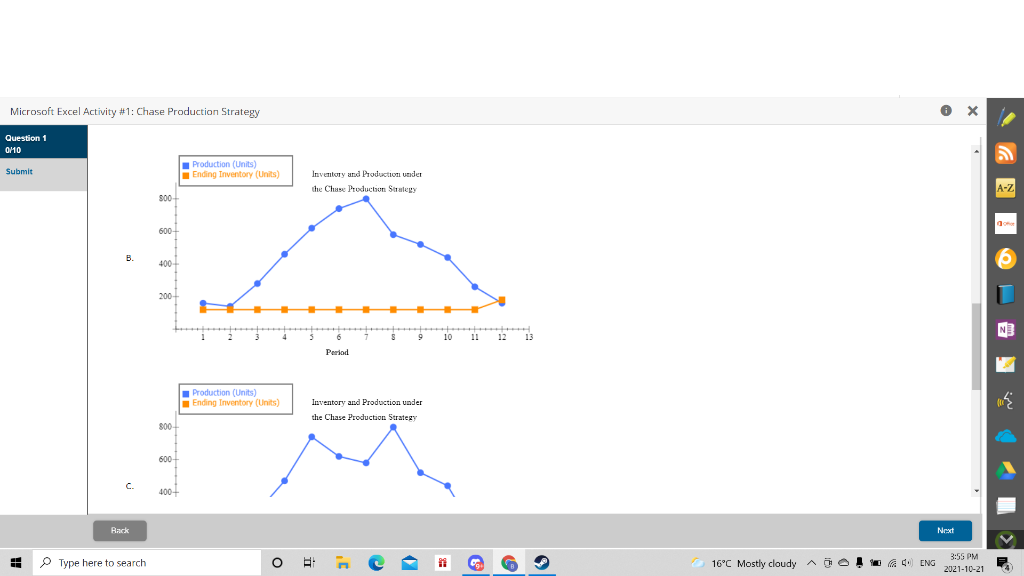
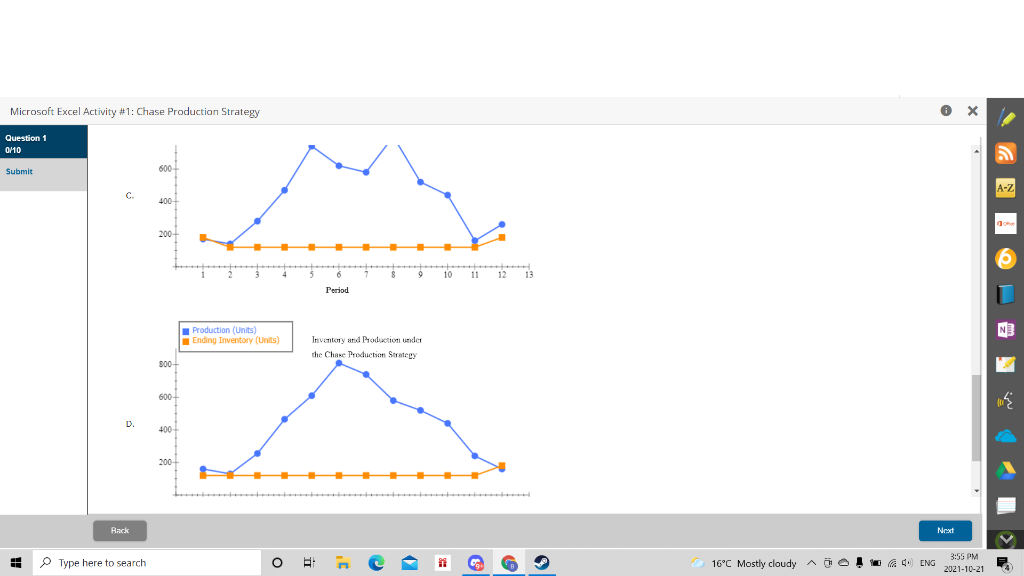
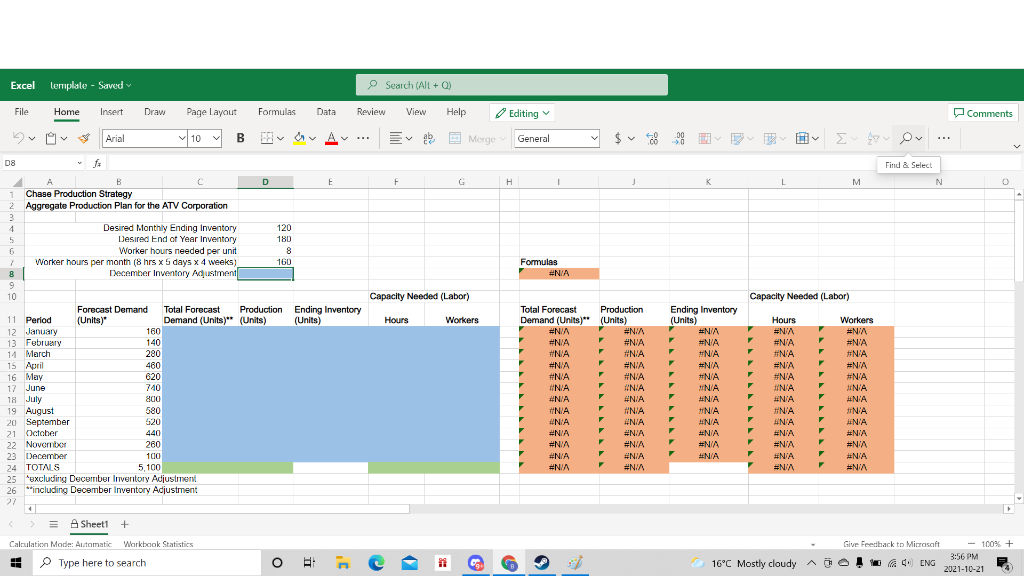
Microsoft Excel Activity #1: Chase Production Strategy 0 X Question 1 0/10 Video Submit Excel Online Structured Activity: Chase Production Strategy The ATV Corporation makes three models of all-terrain vehicles: Model A, Model B, and Model C. Model A uses a 0.1-liter engine, Model B uses a 0.5-liter engine, and Model C uses a 0.6-liter engine. The aggregate production plan is the twelve-month plan that combines all three models together in total monthly production. The planning horizon is twelve months. The APP determines the size of the workforce, which is the constrained resource. Assume that the beginning inventory for January and that the desired monthly ending inventory is 120 units (30 units each of Model A and Model B, and 60 units of Model C), and the finn desires to have an ending inventory of 180 units at the end of the year. On average, one unit of ATV requires eight labor hours to produce, and a worker contributes 160 hours (8 hours x 5 days x 4 wocks) per month. The data has been collected in the Microsoft Excel Online file below. Use the Microsoft Excel Online filc below to develop the chase production strategy and answer the following questions. Open spreadsheet NE Questions 1. What are the totals of the forecast demand (including inventory adjustment for December), production, hours and workers associated with aggregate production plan? (Hint: find the total number of workers as the sum of workers required during each month.) Round your answers to the nearest whole number Forecast Demand (Units) Production (Units) Capacity Needed Hours Workers 2. Choose the correct graph for the inventory and production under chase production strategy. The correct graph is Back Next 1 Type here to search O 16C Mostly cloudy AOO! ENG 3:54 PM 2021-10-21 Microsoft Excel Activity #1: Chase Production Strategy X Question 1 010 2. Choose the correct graph for the inventory and production under chase production strategy. Submit The correct graph is Production (Units) Ending Inventory (Units) Inventory and Production under the Chase Production Strategy 800 600 A 400- 200+ 10 11 Period Production (Units) Ending Inventory (Units) Inventory and Production under the Chase Production Strategy 800 Back Next 1 Type here to search O 16C Mostly cloudy AOO! ENG 3:54 PM 2021-10-21 Microsoft Excel Activity #1: Chase Production Strategy 0 X Question 1 0/10 Submit Production (Units) Ending Inventory (Units) Inventory and Production under the Chase Production Strategy 800 600 B 400- 200 10 Period Production (Units) Ending Inventory (Units) Inventory and Production under the Chase Production Strategy 800 600 C. 400+ Back Next 1 Type here to search O 16C Mostly cloudy AOO! ENG 3:55 PM 2021-10-21 Microsoft Excel Activity #1: Chase Production Strategy 0 X Question 1 010 Submit 600 C 400 M 200- 10 11 Period Production (Units) Ending Inventory (Units) Inventory and Production under the Chase Production Strategy 800 600 D. 400 200 Back Next 1 Type here to search 16C Mostly cloudy AOO! ENG 3:55 PM 2021-10-21 Excel Template - Saved Search (All + 0) File Home Insert Draw Page Layout Formulas Data Review View Help Editing Comments v Arial 10 B HY A V General Merge $ v V [ifi .. 7 Ov D8 Find & Select F G H 1 K L M N - Formulas #NIA Capacity Needed (Labor) Capacity Needed (Labor) Hours Workers 140 F A B D D E 1 Chase Production Strategy 2 Aggregate Production Plan for the ATV Corporation 3 4 Desired Monthly Ending Inventory 120 5 Desired End of Year Inventory 180 Worker hours needed per unit 8 Worker hours per month (8 hrs x 5 days x 4 weeks) 160 8 December Inventory Mustment 9 10 Forecast Demand Total Forecast Production Ending Inventory 11 Period (Units) Demand (Units)" (Units) (Units) 12 January 160 13 February 14 March 280 15 April 460 16 May 620 17 June 740 18 July 800 19 August 580 20 September 520 21 October 440 22 November 260 23 December 100 24 TOTALS 5.100 25 'excluding December Inventory Adjustment 26 including December Inventory Adjustment 27 + = Sheet1 + Calculation Mode: Automatic Workbook Statistics Type here to search on Total Forecast Production Demand (Units)" (Units) =NIA #NIN #N/A #N/A #NIA F #N/A #N/A F #NIA #NIA #N/A #NA F UNIA #NIA F #N/A #NA F ANIA #N/A F ANIA #N/A #NIA #N/A F #N/A #N/A #NIA F #N/A #NI #NA Ending Inventory (Units) #N/A #N/A F #N/A #N/A #N/A F #N/A / #N/A N/A ANA #NIA #N/A #N/A F Hours #NA #N/A #N/A #N/A #NA INA #N/A INA #NA #NA # #NIA #N/A NA Workers #NIA #N/A #N/A #NA #N/A UNA ANA NA UNIA #NA ENIA #N/A NA F F F Give Feedback to Microsoft - 100% + 3:56 PM 16C Mostly cloudy AGO!ENG 4. 2021-10-21 Microsoft Excel Activity #1: Chase Production Strategy 0 X Question 1 0/10 Video Submit Excel Online Structured Activity: Chase Production Strategy The ATV Corporation makes three models of all-terrain vehicles: Model A, Model B, and Model C. Model A uses a 0.1-liter engine, Model B uses a 0.5-liter engine, and Model C uses a 0.6-liter engine. The aggregate production plan is the twelve-month plan that combines all three models together in total monthly production. The planning horizon is twelve months. The APP determines the size of the workforce, which is the constrained resource. Assume that the beginning inventory for January and that the desired monthly ending inventory is 120 units (30 units each of Model A and Model B, and 60 units of Model C), and the finn desires to have an ending inventory of 180 units at the end of the year. On average, one unit of ATV requires eight labor hours to produce, and a worker contributes 160 hours (8 hours x 5 days x 4 wocks) per month. The data has been collected in the Microsoft Excel Online file below. Use the Microsoft Excel Online filc below to develop the chase production strategy and answer the following questions. Open spreadsheet NE Questions 1. What are the totals of the forecast demand (including inventory adjustment for December), production, hours and workers associated with aggregate production plan? (Hint: find the total number of workers as the sum of workers required during each month.) Round your answers to the nearest whole number Forecast Demand (Units) Production (Units) Capacity Needed Hours Workers 2. Choose the correct graph for the inventory and production under chase production strategy. The correct graph is Back Next 1 Type here to search O 16C Mostly cloudy AOO! ENG 3:54 PM 2021-10-21 Microsoft Excel Activity #1: Chase Production Strategy X Question 1 010 2. Choose the correct graph for the inventory and production under chase production strategy. Submit The correct graph is Production (Units) Ending Inventory (Units) Inventory and Production under the Chase Production Strategy 800 600 A 400- 200+ 10 11 Period Production (Units) Ending Inventory (Units) Inventory and Production under the Chase Production Strategy 800 Back Next 1 Type here to search O 16C Mostly cloudy AOO! ENG 3:54 PM 2021-10-21 Microsoft Excel Activity #1: Chase Production Strategy 0 X Question 1 0/10 Submit Production (Units) Ending Inventory (Units) Inventory and Production under the Chase Production Strategy 800 600 B 400- 200 10 Period Production (Units) Ending Inventory (Units) Inventory and Production under the Chase Production Strategy 800 600 C. 400+ Back Next 1 Type here to search O 16C Mostly cloudy AOO! ENG 3:55 PM 2021-10-21 Microsoft Excel Activity #1: Chase Production Strategy 0 X Question 1 010 Submit 600 C 400 M 200- 10 11 Period Production (Units) Ending Inventory (Units) Inventory and Production under the Chase Production Strategy 800 600 D. 400 200 Back Next 1 Type here to search 16C Mostly cloudy AOO! ENG 3:55 PM 2021-10-21 Excel Template - Saved Search (All + 0) File Home Insert Draw Page Layout Formulas Data Review View Help Editing Comments v Arial 10 B HY A V General Merge $ v V [ifi .. 7 Ov D8 Find & Select F G H 1 K L M N - Formulas #NIA Capacity Needed (Labor) Capacity Needed (Labor) Hours Workers 140 F A B D D E 1 Chase Production Strategy 2 Aggregate Production Plan for the ATV Corporation 3 4 Desired Monthly Ending Inventory 120 5 Desired End of Year Inventory 180 Worker hours needed per unit 8 Worker hours per month (8 hrs x 5 days x 4 weeks) 160 8 December Inventory Mustment 9 10 Forecast Demand Total Forecast Production Ending Inventory 11 Period (Units) Demand (Units)" (Units) (Units) 12 January 160 13 February 14 March 280 15 April 460 16 May 620 17 June 740 18 July 800 19 August 580 20 September 520 21 October 440 22 November 260 23 December 100 24 TOTALS 5.100 25 'excluding December Inventory Adjustment 26 including December Inventory Adjustment 27 + = Sheet1 + Calculation Mode: Automatic Workbook Statistics Type here to search on Total Forecast Production Demand (Units)" (Units) =NIA #NIN #N/A #N/A #NIA F #N/A #N/A F #NIA #NIA #N/A #NA F UNIA #NIA F #N/A #NA F ANIA #N/A F ANIA #N/A #NIA #N/A F #N/A #N/A #NIA F #N/A #NI #NA Ending Inventory (Units) #N/A #N/A F #N/A #N/A #N/A F #N/A / #N/A N/A ANA #NIA #N/A #N/A F Hours #NA #N/A #N/A #N/A #NA INA #N/A INA #NA #NA # #NIA #N/A NA Workers #NIA #N/A #N/A #NA #N/A UNA ANA NA UNIA #NA ENIA #N/A NA F F F Give Feedback to Microsoft - 100% + 3:56 PM 16C Mostly cloudy AGO!ENG 4. 2021-10-21


