

Question: Microsoft x Sign out x Module 1 x XA Module 1: X L Cengage x Course H X MindTap X L Cengage X B Brainly
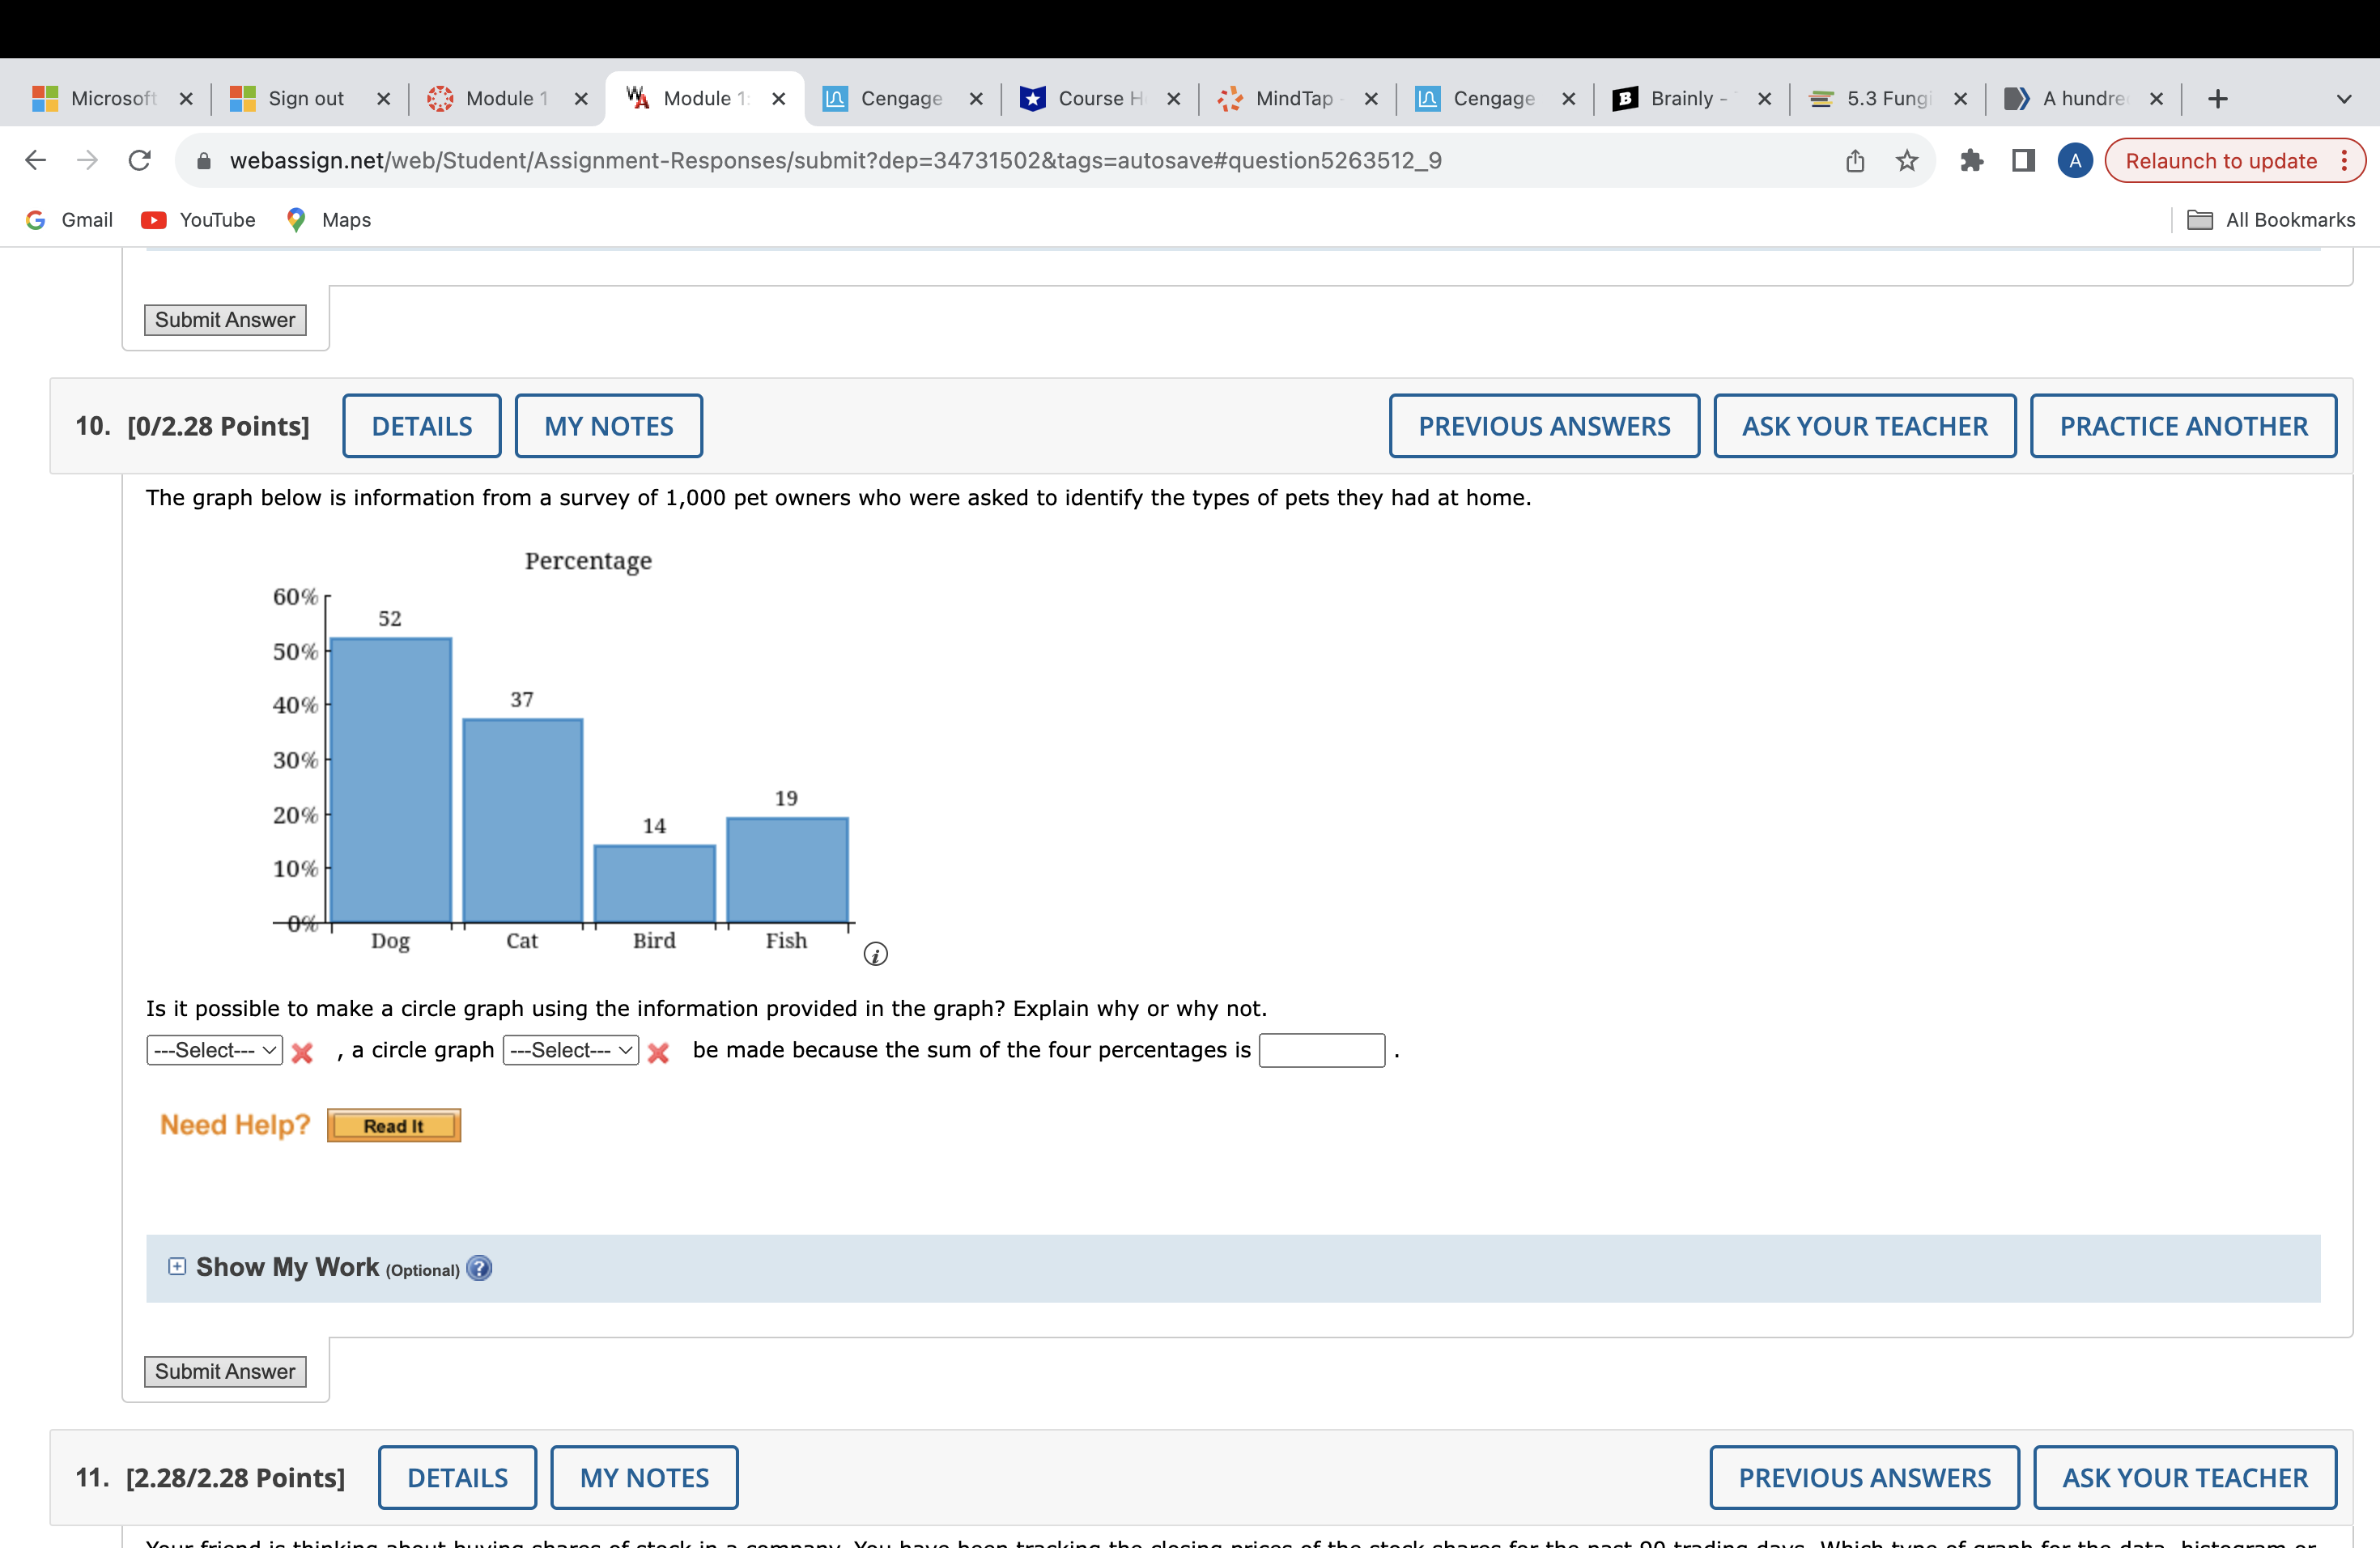
Microsoft x Sign out x Module 1 x XA Module 1: X L Cengage x Course H X MindTap X L Cengage X B Brainly - X = 5.3 Fungi X > A hundre + webassign.net/web/Student/Assignment-Responses/submit? dep=34731502&tags=autosave#question5263512_9 * IA Relaunch to update G Gmail YouTube Maps All Bookmarks Submit Answer 10. [0/2.28 Points] DETAILS MY NOTES PREVIOUS ANSWERS ASK YOUR TEACHER PRACTICE ANOTHER The graph below is information from a survey of 1,000 pet owners who were asked to identify the types of pets they had at home. Percentage 60% 52 50% 40% 37 30% 19 20% 14 10% Dog Cat Bird Fish Is it possible to make a circle graph using the information provided in the graph? Explain why or why not. ---Select--- X , a circle graph ---Select--- X be made because the sum of the four percentages is Need Help? Read It Show My Work (Optional) ? Submit Answer 11. [2.28/2.28 Points] DETAILS MY NOTES PREVIOUS ANSWERS ASK YOUR TEACHER
Step by Step Solution
There are 3 Steps involved in it

Get step-by-step solutions from verified subject matter experts