

Question: milion; $1.6 million; and $2.3 million. b. Plot the average tax rates (measured on the y-axis) against the pretax income levels (measured on the x-axis).
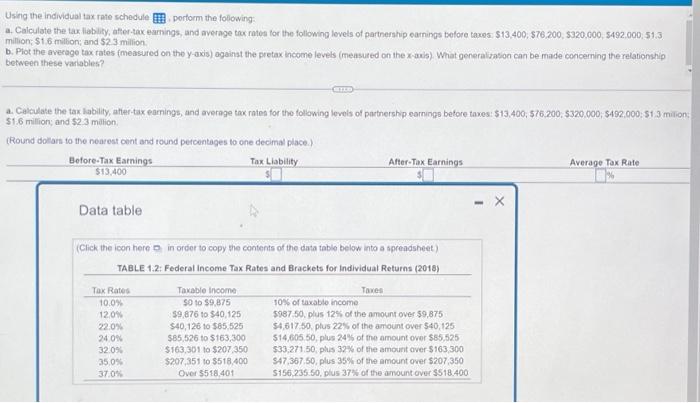
milion; $1.6 million; and $2.3 million. b. Plot the average tax rates (measured on the y-axis) against the pretax income levels (measured on the x-axis). What generalizason can be made concerning the relationship between thetse variables? a. Calculate the tax lability, after-tax eamings, and average tax raten for the following levols of parthership carnings betore taxes: $13,400;576,200;5320,000;$492,000;$1,3 milion $1.6 million; and $2.3 mation. (Round botis to the newares roint and round percentages to one decimal place.) Data table (Click the icon here 0 in order to copy the contents of the data table below into a spreadsheet) TABLE 1.2: Federal income Tax Rates and Brackets for Individual Returns (2018)
Step by Step Solution
There are 3 Steps involved in it

Get step-by-step solutions from verified subject matter experts