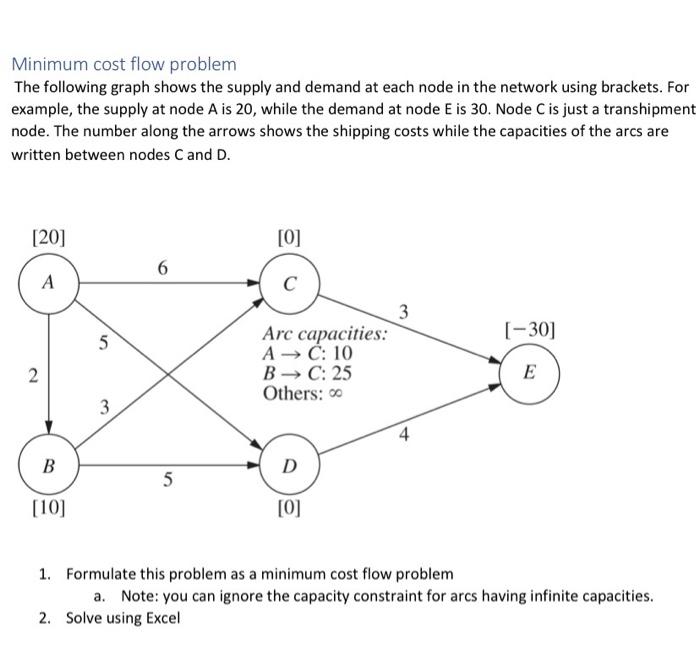
Question: Minimum cost flow problem The following graph shows the supply and demand at each node in the network using brackets. For example, the supply at

Minimum cost flow problem The following graph
Minimum cost flow problem The following graph shows the supply and demand at each node in the network using brackets. For example, the supply at node A is 20, while the demand at node E is 30. Node Cis just a transhipment node. The number along the arrows shows the shipping costs while the capacities of the arcs are written between nodes C and D. [20] [0] 6 A [-30] 5 3 Arc capacities: A C: 10 BC: 25 Others: 2 E 3 B D 5 [10] [0] 1. Formulate this problem as a minimum cost flow problem a. Note: you can ignore the capacity constraint for arcs having infinite capacities. 2. Solve using Excel

Step by Step Solution

There are 3 Steps involved in it

1 Expert Approved Answer
Step: 1 Unlock blur-text-image
Question Has Been Solved by an Expert!

Get step-by-step solutions from verified subject matter experts

Step: 2 Unlock
Step: 3 Unlock

Students Have Also Explored These Related General Management Questions!