

Question: Minitab Exercise Pareto Chart Mini Case (Rev 1_22, Minitab 20) A Pareto chart is a bar chart that depicts the frequency or cost (money, time).
Minitab Exercise Pareto Chart Mini Case (Rev 1_22, Minitab 20)
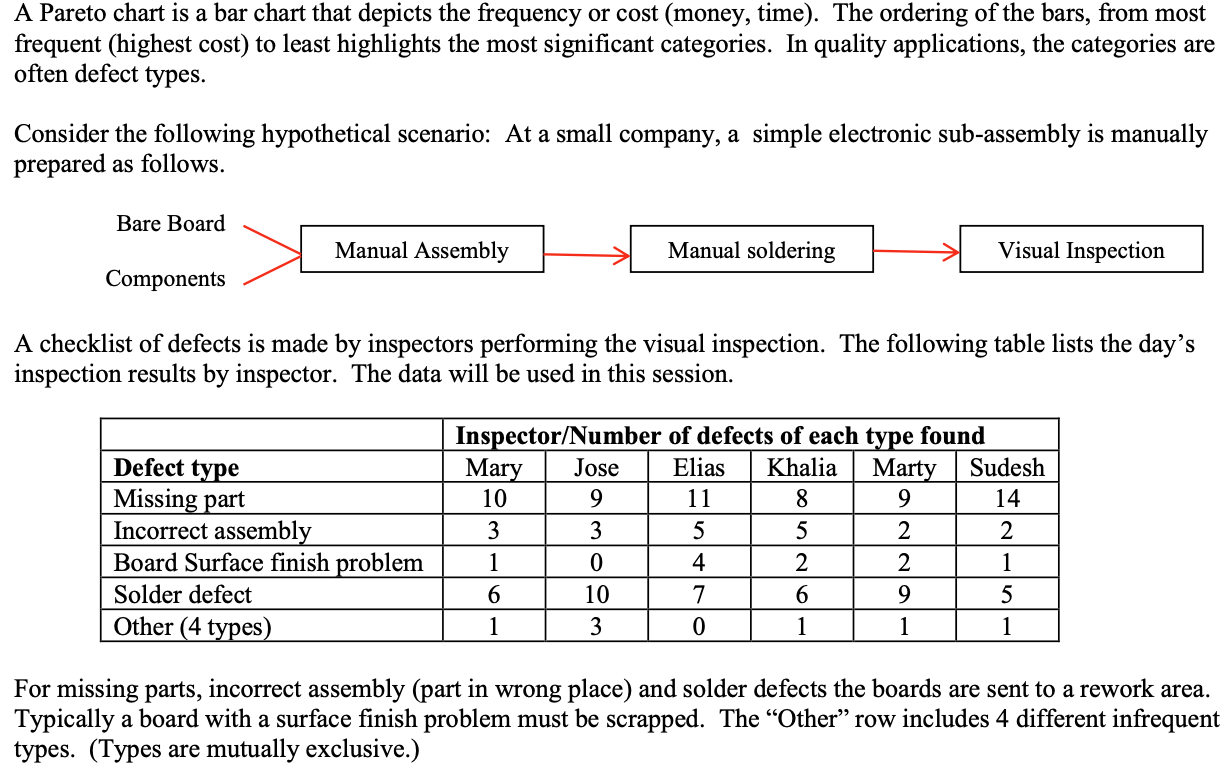
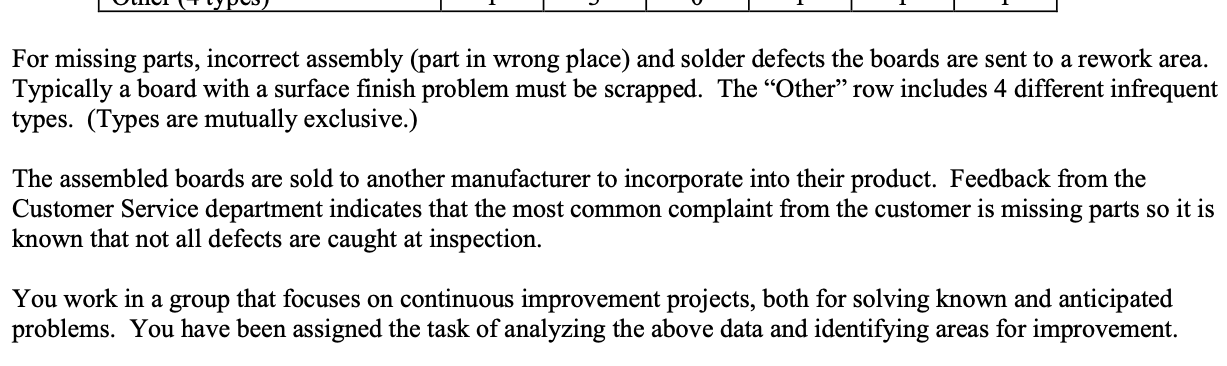
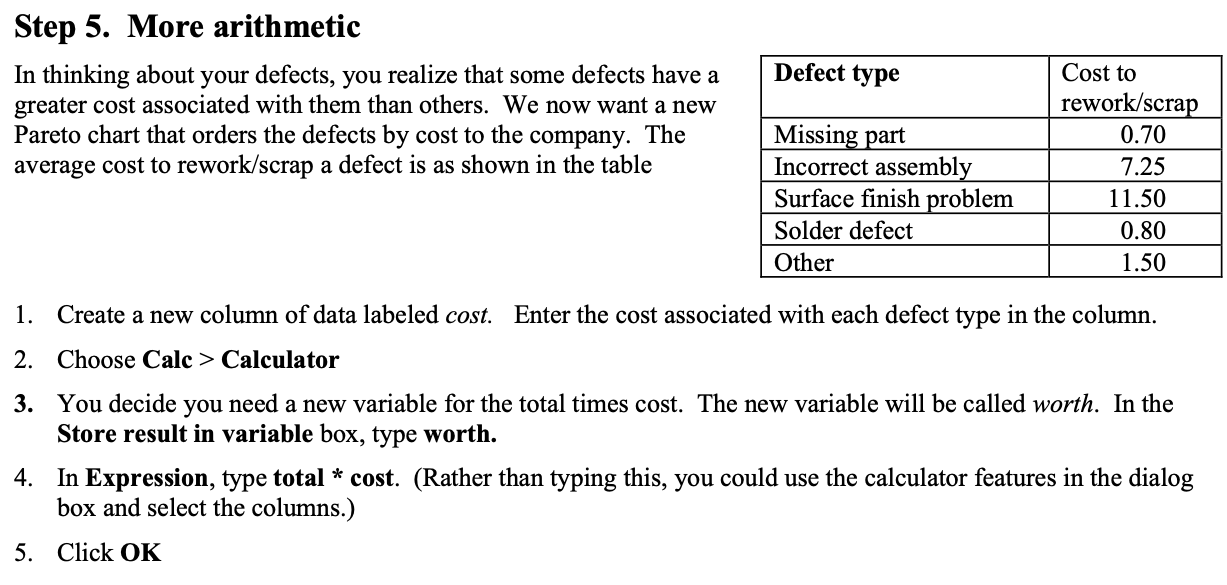
A Pareto chart is a bar chart that depicts the frequency or cost (money, time). The ordering of the bars, from most frequent (highest cost) to least highlights the most signicant categories. In quality applications, the categories are often defect types. Consider the following hypothetical scenario: At a small company, a simple electronic subassembly is manually prepared as follows. Bare Board Manual Assembly Manual soldering Visual Inspection A checklist of defects is made by inspectors performing the visual inspection. The following table lists the day's inspection results by inspector. The data will be used in this session. Components Ins . octet/Number of defects of each 1- e found mun-\"n -nn -_mn -n_-----n For missing parts, incorrect assembly (part in wrong place) and solder defects the boards are sent to a rework area. Typically a board with a surface nish problem must be scrapped. The \"Other\" row includes 4 different infrequent types. (Types are mutually exclusive.) \"luv; *r I. w A u u L 4 J. For missing parts, incorrect assembly (part in wrong place) and solder defects the boards are sent to a rework area. Typically a board with a surface nish problem must be scrapped. The \"Other\" row includes 4 different infrequent types. (Types are mutually exclusive.) The assembled boards are sold to another manufacturer to incorporate into their product. Feedback from the Customer Service department indicates that the most common complaint 'om the customer is missing parts so it is known that not all defects are caught at inspection. You work in a group that focuses on continuous improvement projects, both for solving known and anticipated problems. You have been assigned the task of analyzing the above data and identifying areas for improvement. Step 5. More arithmetic 1n thinking about your defects, you realize that some defects have a greater cost associated with them than others. We now want a new rework/scra l Pareto chart that orders the defects by cost to the company. The W average cost to rework/scrap a defect is as shown in the table Surface nish I oblem 11.50 Solder defect 1. Create a new column of data labeled cost. Enter the cost associated with each defect type in the column. 2. Choose Calc > Calculator 3. You decide you need a new variable for the total times cost. The new variable will be called worth. In the Store result in variable box, type worth. 4. 1n Expression, type total * cost. (Rather than typing this, you could use the calculator features in the dialog box and select the columns.) 5 . Click OK
Step by Step Solution
There are 3 Steps involved in it

Get step-by-step solutions from verified subject matter experts