

Question: Mirror Inc. has developed a powerful efficient Golf Cart that is significantly less polluting than existing golf carts currently on the market. The company spent
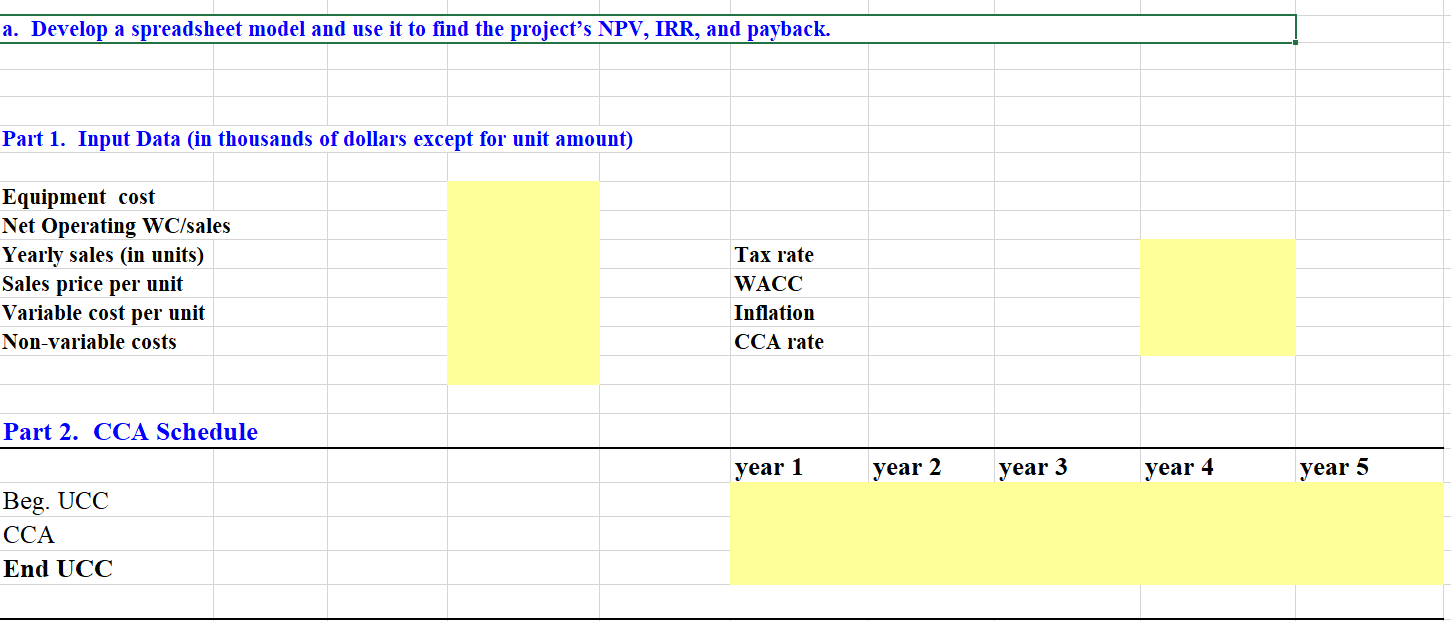
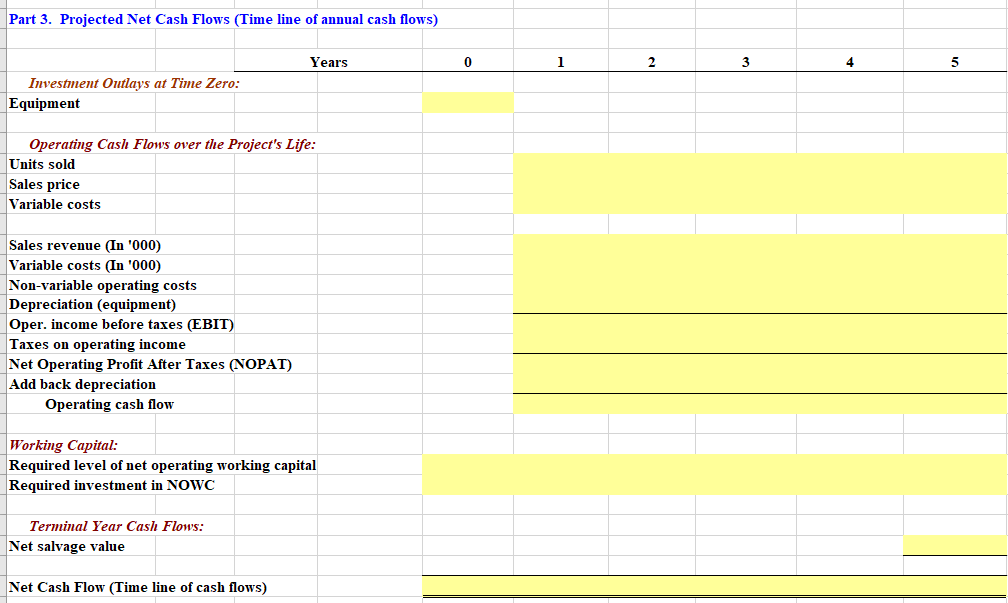
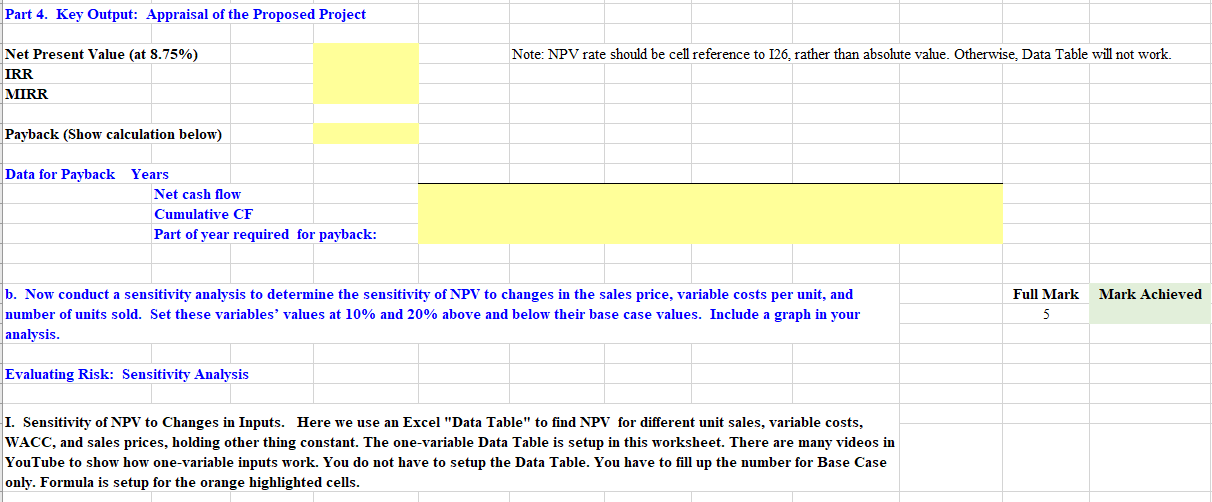
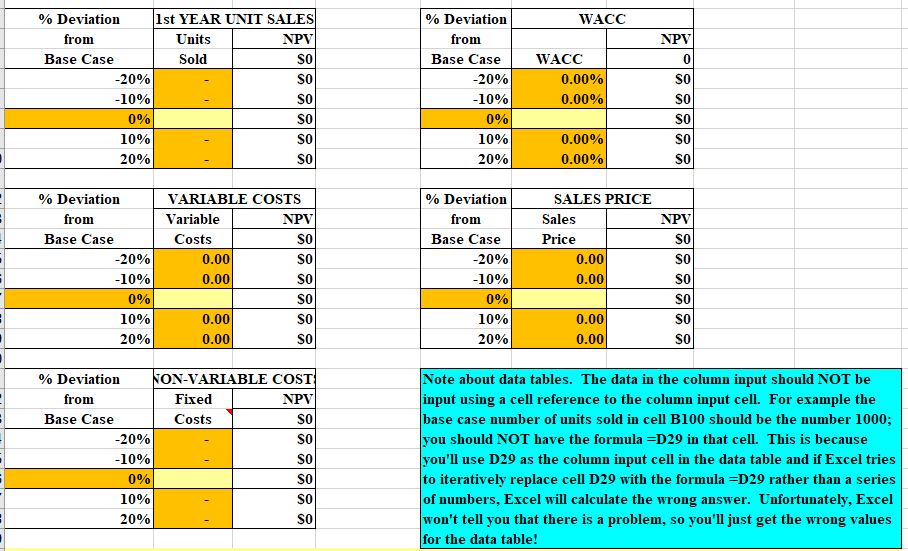
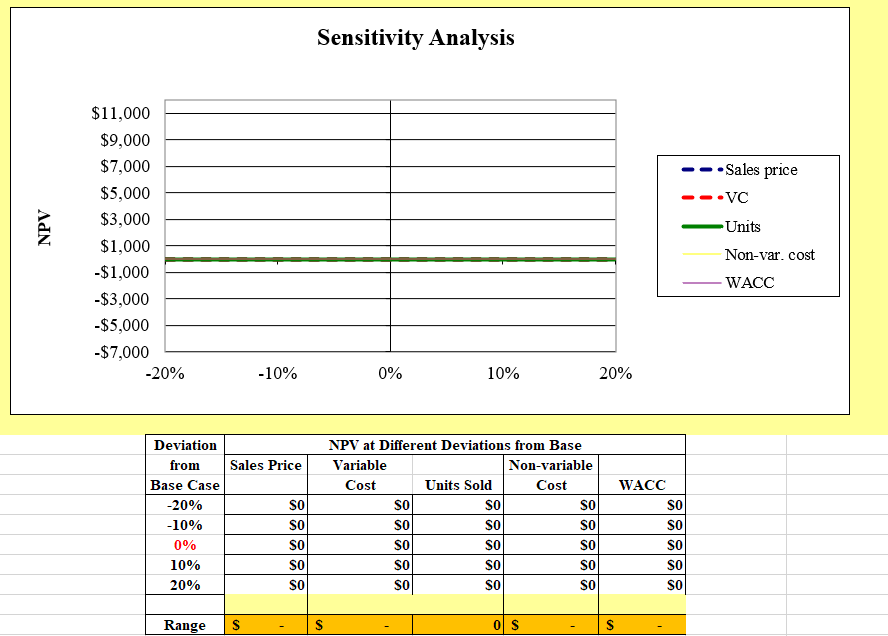
Mirror Inc. has developed a powerful efficient Golf Cart that is significantly less polluting than existing golf carts currently on the market. The company spent $1,500,000 developing this product and the marketing department spent another $250,000 to assess the market demand. It would cost $18 million at Year 0 to buy the equipment necessary to manufacture the efficient golf cart. The project would require net working capital at the beginning of each year equal to 23% of sales (NOWCO = 23%(Sales1), NOWc1 = 23%(Sales2), etc.). The efficient golf carts would sell for $2,750 per unit, and Mirro believes that variable costs would amount to $810 per unit. The company expects that the sales price and variable costs would increase at the inflation rate of 1.8% after year 1. The company's non-variable costs would be $760,000 in Year 1 and are expected to increase with inflation. The efficient golf cart project would have a life of 5 years. If the project is undertaken, it must be continued for the entire 5 years. Also, the project's returns are expected to be highly correlated with returns on the firm's other assets. The firm believes it could sell 3,750 units per year. The equipment would be depreciated using a CCA rate of 30%. The estimated market value of the equipment at the end of the project's 5-year life is its undepreciated capital cost (i.e. book value) at the end of year 5. Mirror has other assets in this asset class. Mirror Inc.'s federal-plus-provincial tax rate is 30%. Its cost of capital is 8.75% for average risk projects. Low-risk projects are evaluated with a WACC of 5.5%, and high-risk projects at 11.25%. Assume that the half-year rule applies to the CCA. The company's capital structure is based on long term debt-financing (weight 20%, avg rate 5%), preferred shares (weight 30%, avg rate 7.5%) and common shares (weight 50%, avg rate 11.6%). a. Develop a spreadsheet model and use it to find the project's NPV, IRR, and payback. Part 1. Input Data (in thousands of dollars except for unit amount) Tax rate Equipment cost Net Operating WC/sales Yearly sales (in units) Sales price per unit Variable cost per unit Non-variable costs WACC Inflation CCA rate Part 2. CCA Schedule year 1 year 2 year 3 year 4 year 5 Beg. UCC CCA End UCC Part 3. Projected Net Cash Flows (Time line of annual cash flows) Years 0 1 2 3 4 5 Investment Outlays at Time Zero: Equipment Operating Cash Flows over the Project's Life: Units sold Sales price Variable costs Sales revenue (In '000) Variable costs (In '000) Non-variable operating costs Depreciation (equipment) Oper. income before taxes (EBIT) Taxes on operating income Net Operating Profit After Taxes (NOPAT) Add back depreciation Operating cash flow Working Capital: Required level of net operating working capital Required investment in NOWC Terminal Year Cash Flows: Net salvage value Net Cash Flow (Time line of cash flows) Part 4. Key Output: Appraisal of the Proposed Project Note: NPV rate should be cell reference to 126, rather than absolute value. Otherwise, Data Table will not work. Net Present Value (at 8.75%) IRR MIRR Payback (Show calculation below) Data for Payback Years Net cash flow Cumulative CF Part of year required for payback: Full Mark Mark Achieved b. Now conduct a sensitivity analysis to determine the sensitivity of NPV to changes in the sales price, variable costs per unit, and number of units sold. Set these variables' values at 10% and 20% above and below their base case values. Include a graph in your analysis. 5 Evaluating Risk: Sensitivity Analysis I. Sensitivity of NPV to Changes in Inputs. Here we use an Excel "Data Table" to find NPV for different unit sales, variable costs, WACC, and sales prices, holding other thing constant. The one-variable Data Table is setup in this worksheet. There are many videos in YouTube to show how one-variable inputs work. You do not have to setup the Data Table. You have to fill up the number for Base Case only. Formula is setup for the orange highlighted cells. % Deviation % Deviation WACC 1st YEAR UNIT SALES Units NPV from from NPV Base Case Sold SO WACC 0 -20% SO 0.00% SO -10% SO 0.00% SO Base Case -20% -10% 0% 10% 20% 0% SO SO 10% SO 0.00% SO 20% SO 0.00% SO % Deviation VARIABLE COSTS % Deviation SALES PRICE from Variable NPV from Sales NPV SO Base Case Price SO Costs 0.00 0.001 SO -20% 0.00 SO SO -10% 0.00 SO Base Case -20% -10% 0% 10% 20% SO 0% SO SO 10% 0.00 SO 0.00 0.001 SO 20% 0.00 SO % Deviation NON-VARIABLE COST Fixed NPV from Base Case Costs SO SO -20% -10% 0% SO Note about data tables. The data in the column input should NOT be input using a cell reference to the column input cell. For example the base case number of units sold in cell B100 should be the number 1000; you should NOT have the formula =D29 in that cell. This is because you'll use D29 as the column input cell in the data table and if Excel tries to iteratively replace cell D29 with the formula =D29 rather than a series of numbers, Excel will calculate the wrong answer. Unfortunately, Excel won't tell you that there is a problem, so you'll just get the wrong values for the data table! SO 10% SO 20% SO Sensitivity Analysis Sales price $11,000 $9,000 $7,000 $5,000 $3,000 $1,000 .VC NPV Units Non-var. cost -$1,000 WACC -$3,000 -$5,000 -$7,000 -20% -10% 0% 10% 20% Deviation NPV at Different Deviations from Base from Sales Price Variable Non-variable Cost Units Sold Cost WACC Base Case -20% SO SO SO SO SO -10% SO SO SO SO SO 0% SO SO SO SO SO 10% SO SO SO SO SO 20% SO SO SO SO SO Range S 0 S Mirror Inc. has developed a powerful efficient Golf Cart that is significantly less polluting than existing golf carts currently on the market. The company spent $1,500,000 developing this product and the marketing department spent another $250,000 to assess the market demand. It would cost $18 million at Year 0 to buy the equipment necessary to manufacture the efficient golf cart. The project would require net working capital at the beginning of each year equal to 23% of sales (NOWCO = 23%(Sales1), NOWc1 = 23%(Sales2), etc.). The efficient golf carts would sell for $2,750 per unit, and Mirro believes that variable costs would amount to $810 per unit. The company expects that the sales price and variable costs would increase at the inflation rate of 1.8% after year 1. The company's non-variable costs would be $760,000 in Year 1 and are expected to increase with inflation. The efficient golf cart project would have a life of 5 years. If the project is undertaken, it must be continued for the entire 5 years. Also, the project's returns are expected to be highly correlated with returns on the firm's other assets. The firm believes it could sell 3,750 units per year. The equipment would be depreciated using a CCA rate of 30%. The estimated market value of the equipment at the end of the project's 5-year life is its undepreciated capital cost (i.e. book value) at the end of year 5. Mirror has other assets in this asset class. Mirror Inc.'s federal-plus-provincial tax rate is 30%. Its cost of capital is 8.75% for average risk projects. Low-risk projects are evaluated with a WACC of 5.5%, and high-risk projects at 11.25%. Assume that the half-year rule applies to the CCA. The company's capital structure is based on long term debt-financing (weight 20%, avg rate 5%), preferred shares (weight 30%, avg rate 7.5%) and common shares (weight 50%, avg rate 11.6%). a. Develop a spreadsheet model and use it to find the project's NPV, IRR, and payback. Part 1. Input Data (in thousands of dollars except for unit amount) Tax rate Equipment cost Net Operating WC/sales Yearly sales (in units) Sales price per unit Variable cost per unit Non-variable costs WACC Inflation CCA rate Part 2. CCA Schedule year 1 year 2 year 3 year 4 year 5 Beg. UCC CCA End UCC Part 3. Projected Net Cash Flows (Time line of annual cash flows) Years 0 1 2 3 4 5 Investment Outlays at Time Zero: Equipment Operating Cash Flows over the Project's Life: Units sold Sales price Variable costs Sales revenue (In '000) Variable costs (In '000) Non-variable operating costs Depreciation (equipment) Oper. income before taxes (EBIT) Taxes on operating income Net Operating Profit After Taxes (NOPAT) Add back depreciation Operating cash flow Working Capital: Required level of net operating working capital Required investment in NOWC Terminal Year Cash Flows: Net salvage value Net Cash Flow (Time line of cash flows) Part 4. Key Output: Appraisal of the Proposed Project Note: NPV rate should be cell reference to 126, rather than absolute value. Otherwise, Data Table will not work. Net Present Value (at 8.75%) IRR MIRR Payback (Show calculation below) Data for Payback Years Net cash flow Cumulative CF Part of year required for payback: Full Mark Mark Achieved b. Now conduct a sensitivity analysis to determine the sensitivity of NPV to changes in the sales price, variable costs per unit, and number of units sold. Set these variables' values at 10% and 20% above and below their base case values. Include a graph in your analysis. 5 Evaluating Risk: Sensitivity Analysis I. Sensitivity of NPV to Changes in Inputs. Here we use an Excel "Data Table" to find NPV for different unit sales, variable costs, WACC, and sales prices, holding other thing constant. The one-variable Data Table is setup in this worksheet. There are many videos in YouTube to show how one-variable inputs work. You do not have to setup the Data Table. You have to fill up the number for Base Case only. Formula is setup for the orange highlighted cells. % Deviation % Deviation WACC 1st YEAR UNIT SALES Units NPV from from NPV Base Case Sold SO WACC 0 -20% SO 0.00% SO -10% SO 0.00% SO Base Case -20% -10% 0% 10% 20% 0% SO SO 10% SO 0.00% SO 20% SO 0.00% SO % Deviation VARIABLE COSTS % Deviation SALES PRICE from Variable NPV from Sales NPV SO Base Case Price SO Costs 0.00 0.001 SO -20% 0.00 SO SO -10% 0.00 SO Base Case -20% -10% 0% 10% 20% SO 0% SO SO 10% 0.00 SO 0.00 0.001 SO 20% 0.00 SO % Deviation NON-VARIABLE COST Fixed NPV from Base Case Costs SO SO -20% -10% 0% SO Note about data tables. The data in the column input should NOT be input using a cell reference to the column input cell. For example the base case number of units sold in cell B100 should be the number 1000; you should NOT have the formula =D29 in that cell. This is because you'll use D29 as the column input cell in the data table and if Excel tries to iteratively replace cell D29 with the formula =D29 rather than a series of numbers, Excel will calculate the wrong answer. Unfortunately, Excel won't tell you that there is a problem, so you'll just get the wrong values for the data table! SO 10% SO 20% SO Sensitivity Analysis Sales price $11,000 $9,000 $7,000 $5,000 $3,000 $1,000 .VC NPV Units Non-var. cost -$1,000 WACC -$3,000 -$5,000 -$7,000 -20% -10% 0% 10% 20% Deviation NPV at Different Deviations from Base from Sales Price Variable Non-variable Cost Units Sold Cost WACC Base Case -20% SO SO SO SO SO -10% SO SO SO SO SO 0% SO SO SO SO SO 10% SO SO SO SO SO 20% SO SO SO SO SO Range S 0 S
Step by Step Solution
There are 3 Steps involved in it

Get step-by-step solutions from verified subject matter experts