

Question: % MISO FF Neuron mapping % ECE/SYS 645 Intelligent Control Systems - Prof KaC Cheok, 11Jan '11 '18 % s1 = W1*U + B1; y1
% MISO FF Neuron mapping
% ECE/SYS 645 Intelligent Control Systems - Prof KaC Cheok, 11Jan '11 '18
% s1 = W1*U + B1; y1 = f1(s1);
% s2 = W2*y1 + B2; y2 = f2(s2)
%% Initialize weights & biases, and variables
clear all; close all; clc;
W1 = [1 0; 0 1]; b1 = [0 0]';
W2 = [1 -1]; b2 = 0;
actfcn1 = 'radbas';
u1 = -10:0.1:10; nCol = length(u1);
u2 = -5:0.1:5; nRow = length(u2);
y2 = zeros(nRow,nCol);
%% FFNN surface using vector formulation
for j = 1: nCol
U = [u1(j)*ones(1,nRow); u2];
s1 = W1*U + b1*ones(1,nRow);
switch actfcn1
case 'radbas', y1 = radbas(s1);
case 'tansig', y1 = tansig(s1);
case 'logsig', y1 = logsig(s1);
end
s2 = W2*y1+b2*ones(1,nRow);
y2(:,j) = s2;
end
%% Plot
figure(1); mesh(u1,u2,y2); grid on; hold on
xlabel('u1'); ylabel('u2'); zlabel('y');
[n1,n0] = size(W1); n2 = size(W2,1);
title([num2str(n0),'-',num2str(n1),'-',num2str(n2),' FNN with ',actfcn1,'-purelin']);
%% Animate
yMinMax = get(gca,'zlim');
PlotIn = plot3(u1(1),u2(1),yMinMax(1),'.c','markersize',25);
PlotOut= plot3(u1(1),u2(1),y2(1,1),'.r','markersize',25);
PlotLn = plot3([1 1]*u1(1),[1 1]*u2(1),[yMinMax(1) y2(1,1)],'-m');
for j = 1:10:nCol
for i = 1:2:nRow
set(PlotIn,'xdata',u1(j),'ydata',u2(i),'zdata',yMinMax(1));
set(PlotOut,'xdata',u1(j),'ydata',u2(i),'zdata',y2(i,j));
set(PlotLn,'xdata',[1 1]*u1(j),'ydata',[1 1]*u2(i),'zdata',[yMinMax(1) y2(i,j)]);
drawnow
end
end
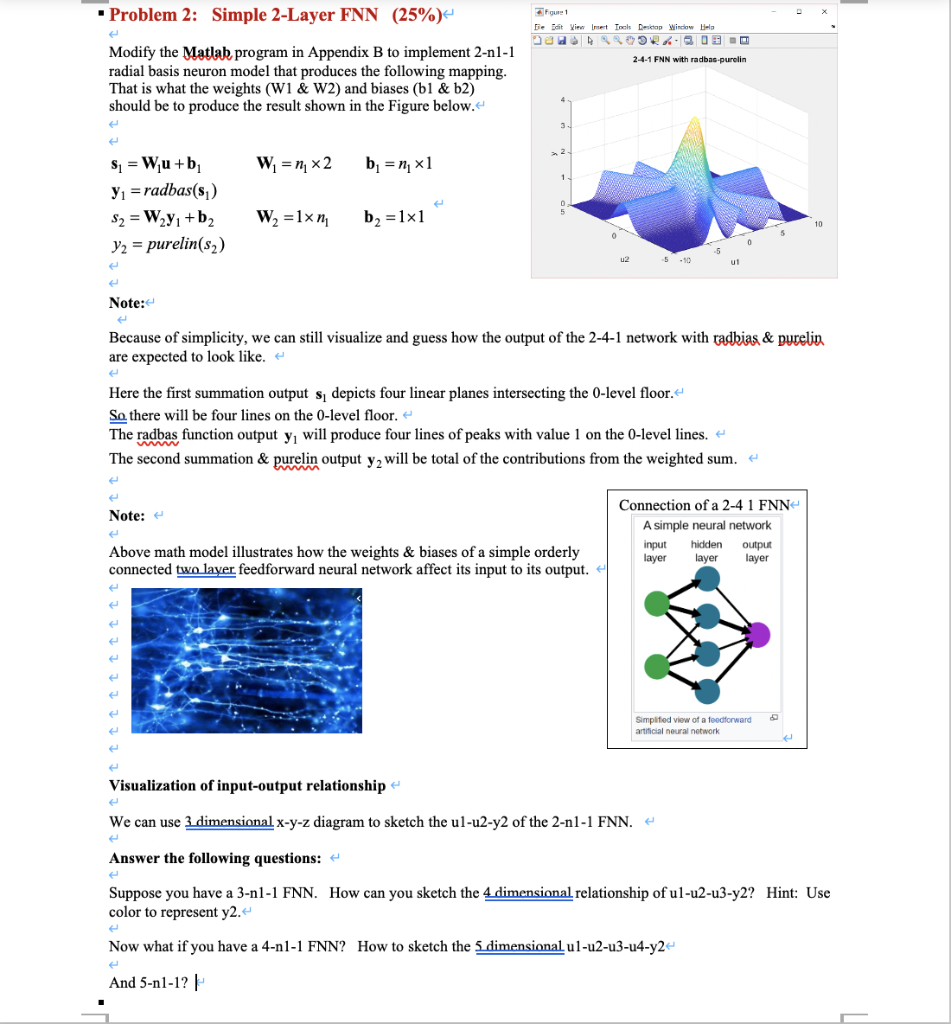
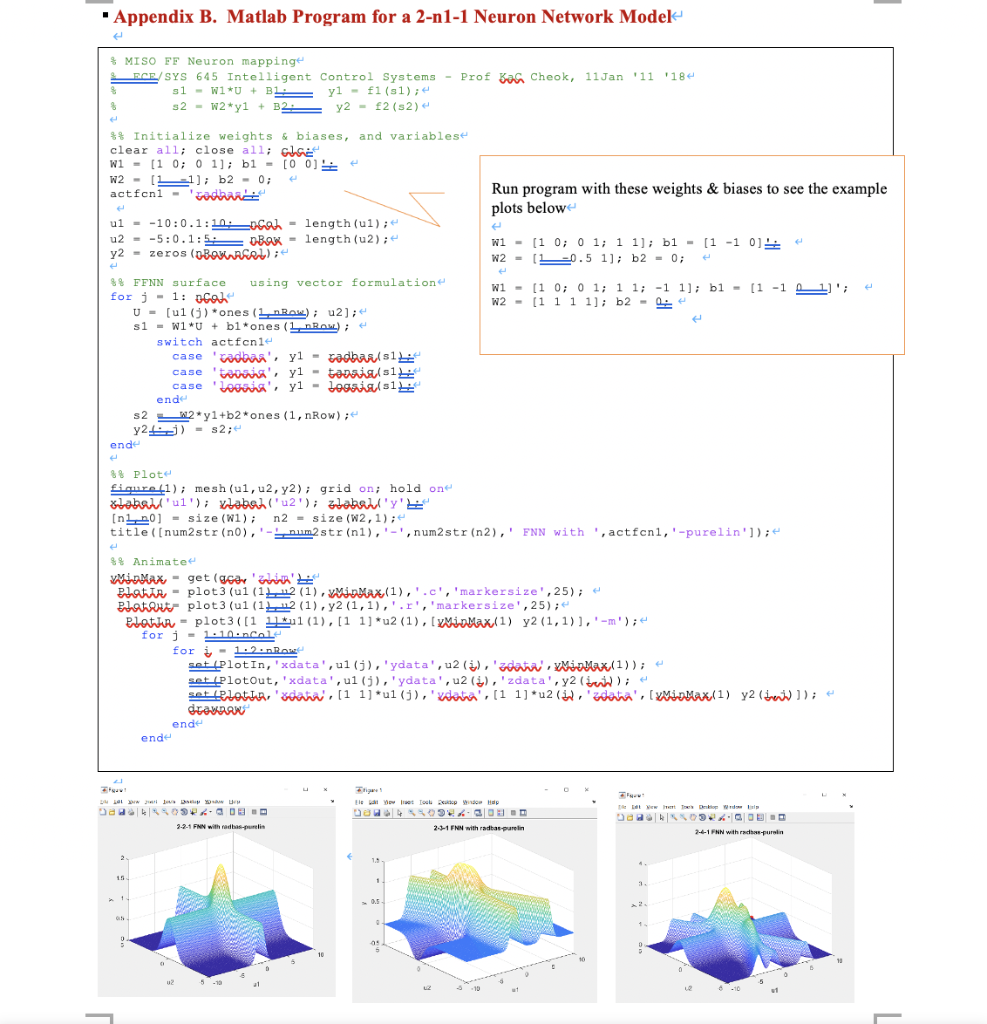
Problem 2: Simple 2-Layer FNN (25%) Modify the Matlab program in Appendix B to implement 2-n1-1 radial basis neuron model that produces the following mapping. That is what the weights (W1 & W2) and biases (bl & b2) should be to produce the result shown in the Figure below. - F1 le Edit View Insert Locks Desktop Window Bela 1912Q0S 244-1 FNN with radbas.purelin W =n, x2 b = n, x1 Si = Wu+b y1 = radbas(s) S2 = W2y + b2 y2 = purelin(s) W2 = 1x n b = 1x1 10 e Note: Because of simplicity, we can still visualize and guess how the output of the 2-4-1 network with radhias & purelin are expected to look like. e Here the first summation output s depicts four linear planes intersecting the 0-level floor. So there will be four lines on the O-level floor. The radbas function output y, will produce four lines of peaks with value 1 on the O-level lines. The second summation & purelin output y2 will be total of the contributions from the weighted sum. Note: Connection of a 2-4 1 FNN A simple neural network input hidden output layer layer layer Above math model illustrates how the weights & biases of a simple orderly connected two layer feedforward neural network affect its input to its output. 4 Simplified view of a foodforward artificial neural network Visualization of input-output relationship We can use 3 dimensional x-y-z diagram to sketch the ul-u2-y2 of the 2-nl-1 FNN. Answer the following questions: Suppose you have a 3-n1-1 FNN. How can you sketch the 4 dimensional relationship of ul-u2-u3-y2? Hint: Use color to represent y2. Now what if you have a 4-n1-1 FNN? How to sketch the 5 dimensional ul-u2-u3-u4-y2 And 5-nl-1? Appendix B. Matlab Program for a 2-n1-1 Neuron Network Model % MISO FF Neuron mappinge ECE/SYS 645 Intelligent Control Systems s1 - W1*U + B12 yl - f1(sl); $ s2 - W2*yi + B2__y2 - 2 (32) Prof Bon Cheok, 11 Jan '11 '184 Run program with these weights & biases to see the example plots below $% Initialize weights & biases, and variables clear all; close all; chce W1 - [1 0; 0 1]; b1 = [00 W2 - [121], b2 - 0; actfcnl - Godric ul : -10:0.1:10: _ocah - length(ul); u2 = -5:0.1:52 Bax - length(2); y2 = zeros (oBarat); 8% FINN surface using vector formulation for j - 1: ofan U = (ul() *ones (2 Box); u2]; s1 - W1*U + bl*ones (LARAW); switch actfcnle case 'cadbar', yl - sadbar's case 'tovsin', yi - tanislls14 case Loco', yi - Legsisisi ende S2 N2*y 1+b2*ones (1, nRow); y2-) = 32; ende W1 - (1 0; 0 1; 1 1]; bl - (1 -1 0 W2 = ( 10.5 1]; b2 = 0; e w1 - [1 0; 0 1; 1 1; -1 1]; bi - [1 -1 1]'; W2 - (1 1 1 1]; b2 - 0 + 8% Plote figure 1); mesh (ui, u2, y2); grid on; hold on wabirl'ul'); wabah ('2'); stabul'y' (nl. 20) = size (wi); n2 = size (W2,1); title{[num2str(no), '-_num2 str(nl),'-', num2 str(n2),' ENN with ', actfcnl,'-purelin']); 8% Animated Min Max - get (corria' Platt - plot 3 (ul(112(1), MinMax (1),'.c','markersize',25); Platant plot 3(u1 (142(1), 72(1,1),'.r','markersize', 25); Platser - plot([1 11*11(1),[1 1]*u2 (1), Winmax(1) y2 (1,1)],'-m'); for j = 1.10.ndale for i - 1.2 now set plotin,'xdata', u1(j), 'ydata', u2(1), 'adata. Mismax(1)); set Plotout, 'xdata', u1(j),'ydata', u2(1), 'zdata', y2 (ww); set pelotta, 'da'. [1 1]*u1 (j),'xdana', [1 1]*u2(1. 'andana', [MinMax(1) y2 (w]); drewna ende ende Els at Yew In Toli kapice Help accep 2-2-1 FNN with radhas-puis 2-3-1 FNN with radharpurin 2-4-1 FNN with pura in 2 15 1 0 09 5 10 j 1 Problem 2: Simple 2-Layer FNN (25%) Modify the Matlab program in Appendix B to implement 2-n1-1 radial basis neuron model that produces the following mapping. That is what the weights (W1 & W2) and biases (bl & b2) should be to produce the result shown in the Figure below. - F1 le Edit View Insert Locks Desktop Window Bela 1912Q0S 244-1 FNN with radbas.purelin W =n, x2 b = n, x1 Si = Wu+b y1 = radbas(s) S2 = W2y + b2 y2 = purelin(s) W2 = 1x n b = 1x1 10 e Note: Because of simplicity, we can still visualize and guess how the output of the 2-4-1 network with radhias & purelin are expected to look like. e Here the first summation output s depicts four linear planes intersecting the 0-level floor. So there will be four lines on the O-level floor. The radbas function output y, will produce four lines of peaks with value 1 on the O-level lines. The second summation & purelin output y2 will be total of the contributions from the weighted sum. Note: Connection of a 2-4 1 FNN A simple neural network input hidden output layer layer layer Above math model illustrates how the weights & biases of a simple orderly connected two layer feedforward neural network affect its input to its output. 4 Simplified view of a foodforward artificial neural network Visualization of input-output relationship We can use 3 dimensional x-y-z diagram to sketch the ul-u2-y2 of the 2-nl-1 FNN. Answer the following questions: Suppose you have a 3-n1-1 FNN. How can you sketch the 4 dimensional relationship of ul-u2-u3-y2? Hint: Use color to represent y2. Now what if you have a 4-n1-1 FNN? How to sketch the 5 dimensional ul-u2-u3-u4-y2 And 5-nl-1? Appendix B. Matlab Program for a 2-n1-1 Neuron Network Model % MISO FF Neuron mappinge ECE/SYS 645 Intelligent Control Systems s1 - W1*U + B12 yl - f1(sl); $ s2 - W2*yi + B2__y2 - 2 (32) Prof Bon Cheok, 11 Jan '11 '184 Run program with these weights & biases to see the example plots below $% Initialize weights & biases, and variables clear all; close all; chce W1 - [1 0; 0 1]; b1 = [00 W2 - [121], b2 - 0; actfcnl - Godric ul : -10:0.1:10: _ocah - length(ul); u2 = -5:0.1:52 Bax - length(2); y2 = zeros (oBarat); 8% FINN surface using vector formulation for j - 1: ofan U = (ul() *ones (2 Box); u2]; s1 - W1*U + bl*ones (LARAW); switch actfcnle case 'cadbar', yl - sadbar's case 'tovsin', yi - tanislls14 case Loco', yi - Legsisisi ende S2 N2*y 1+b2*ones (1, nRow); y2-) = 32; ende W1 - (1 0; 0 1; 1 1]; bl - (1 -1 0 W2 = ( 10.5 1]; b2 = 0; e w1 - [1 0; 0 1; 1 1; -1 1]; bi - [1 -1 1]'; W2 - (1 1 1 1]; b2 - 0 + 8% Plote figure 1); mesh (ui, u2, y2); grid on; hold on wabirl'ul'); wabah ('2'); stabul'y' (nl. 20) = size (wi); n2 = size (W2,1); title{[num2str(no), '-_num2 str(nl),'-', num2 str(n2),' ENN with ', actfcnl,'-purelin']); 8% Animated Min Max - get (corria' Platt - plot 3 (ul(112(1), MinMax (1),'.c','markersize',25); Platant plot 3(u1 (142(1), 72(1,1),'.r','markersize', 25); Platser - plot([1 11*11(1),[1 1]*u2 (1), Winmax(1) y2 (1,1)],'-m'); for j = 1.10.ndale for i - 1.2 now set plotin,'xdata', u1(j), 'ydata', u2(1), 'adata. Mismax(1)); set Plotout, 'xdata', u1(j),'ydata', u2(1), 'zdata', y2 (ww); set pelotta, 'da'. [1 1]*u1 (j),'xdana', [1 1]*u2(1. 'andana', [MinMax(1) y2 (w]); drewna ende ende Els at Yew In Toli kapice Help accep 2-2-1 FNN with radhas-puis 2-3-1 FNN with radharpurin 2-4-1 FNN with pura in 2 15 1 0 09 5 10 j 1
Step by Step Solution
There are 3 Steps involved in it

Get step-by-step solutions from verified subject matter experts