

Question: Missing Value Handling Syntax Definition of Missing Cases Used User-defined missing values for dependent variables are treated as missing. Statistics are based on cases
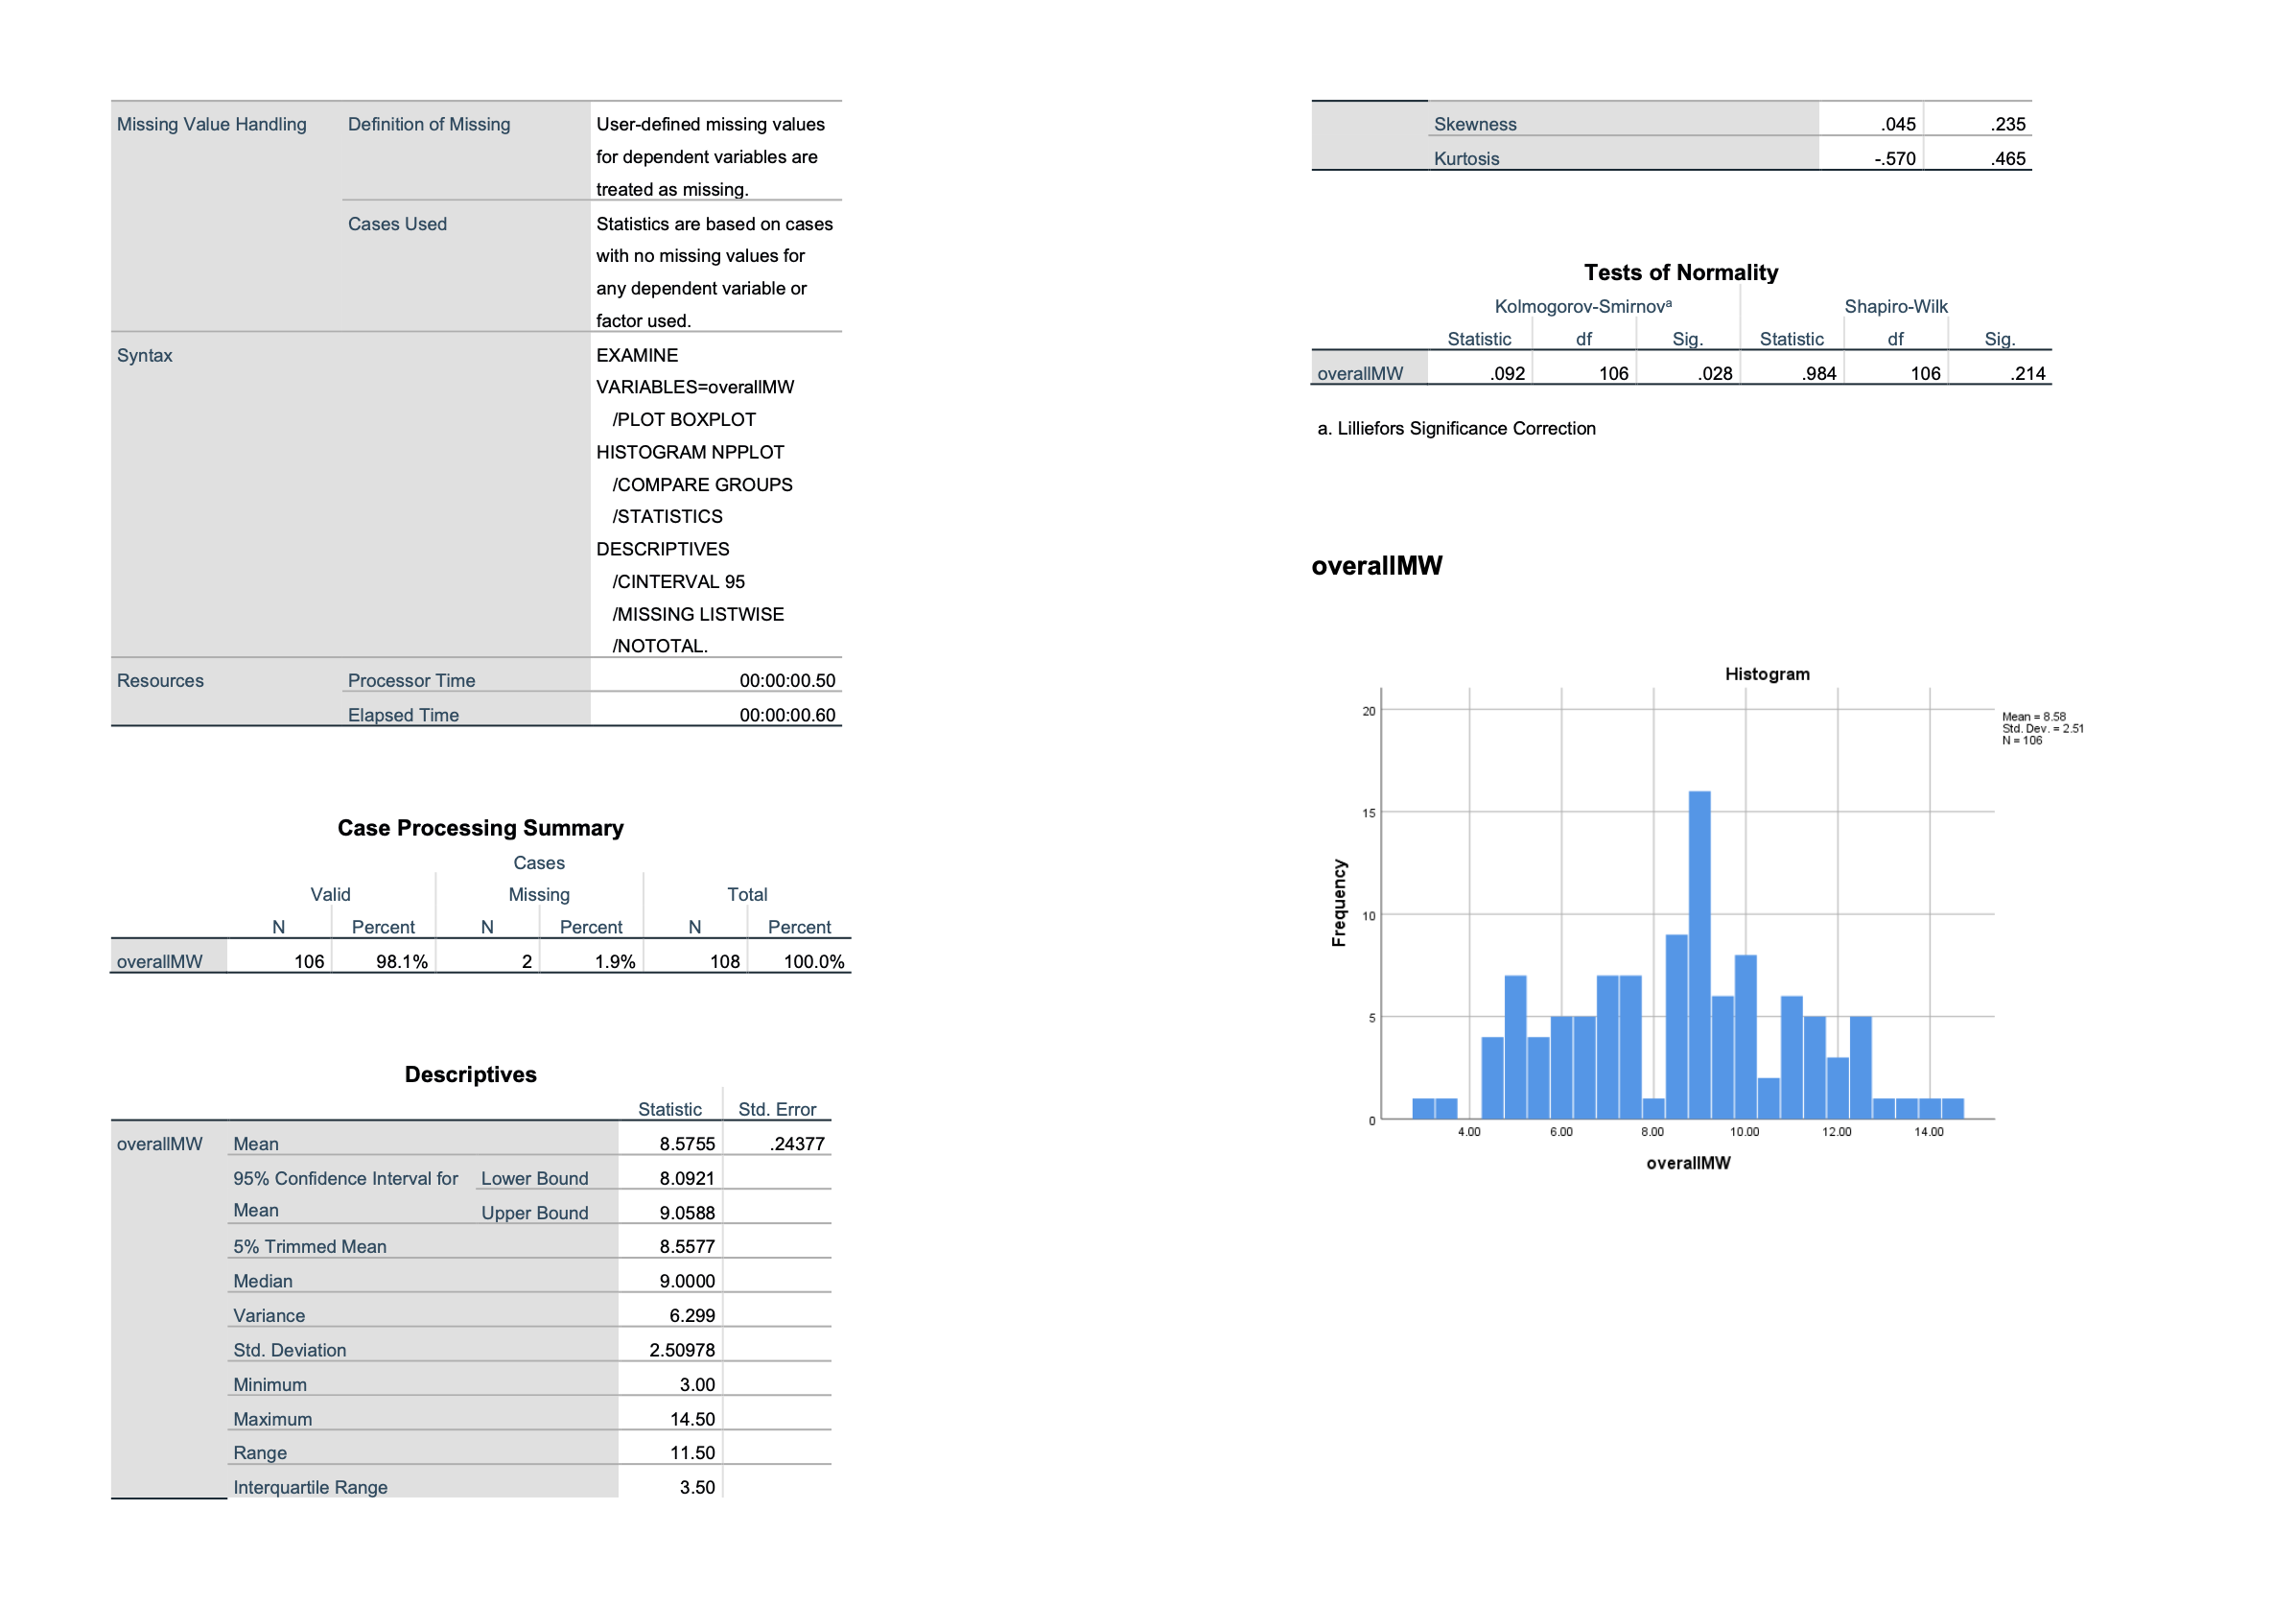
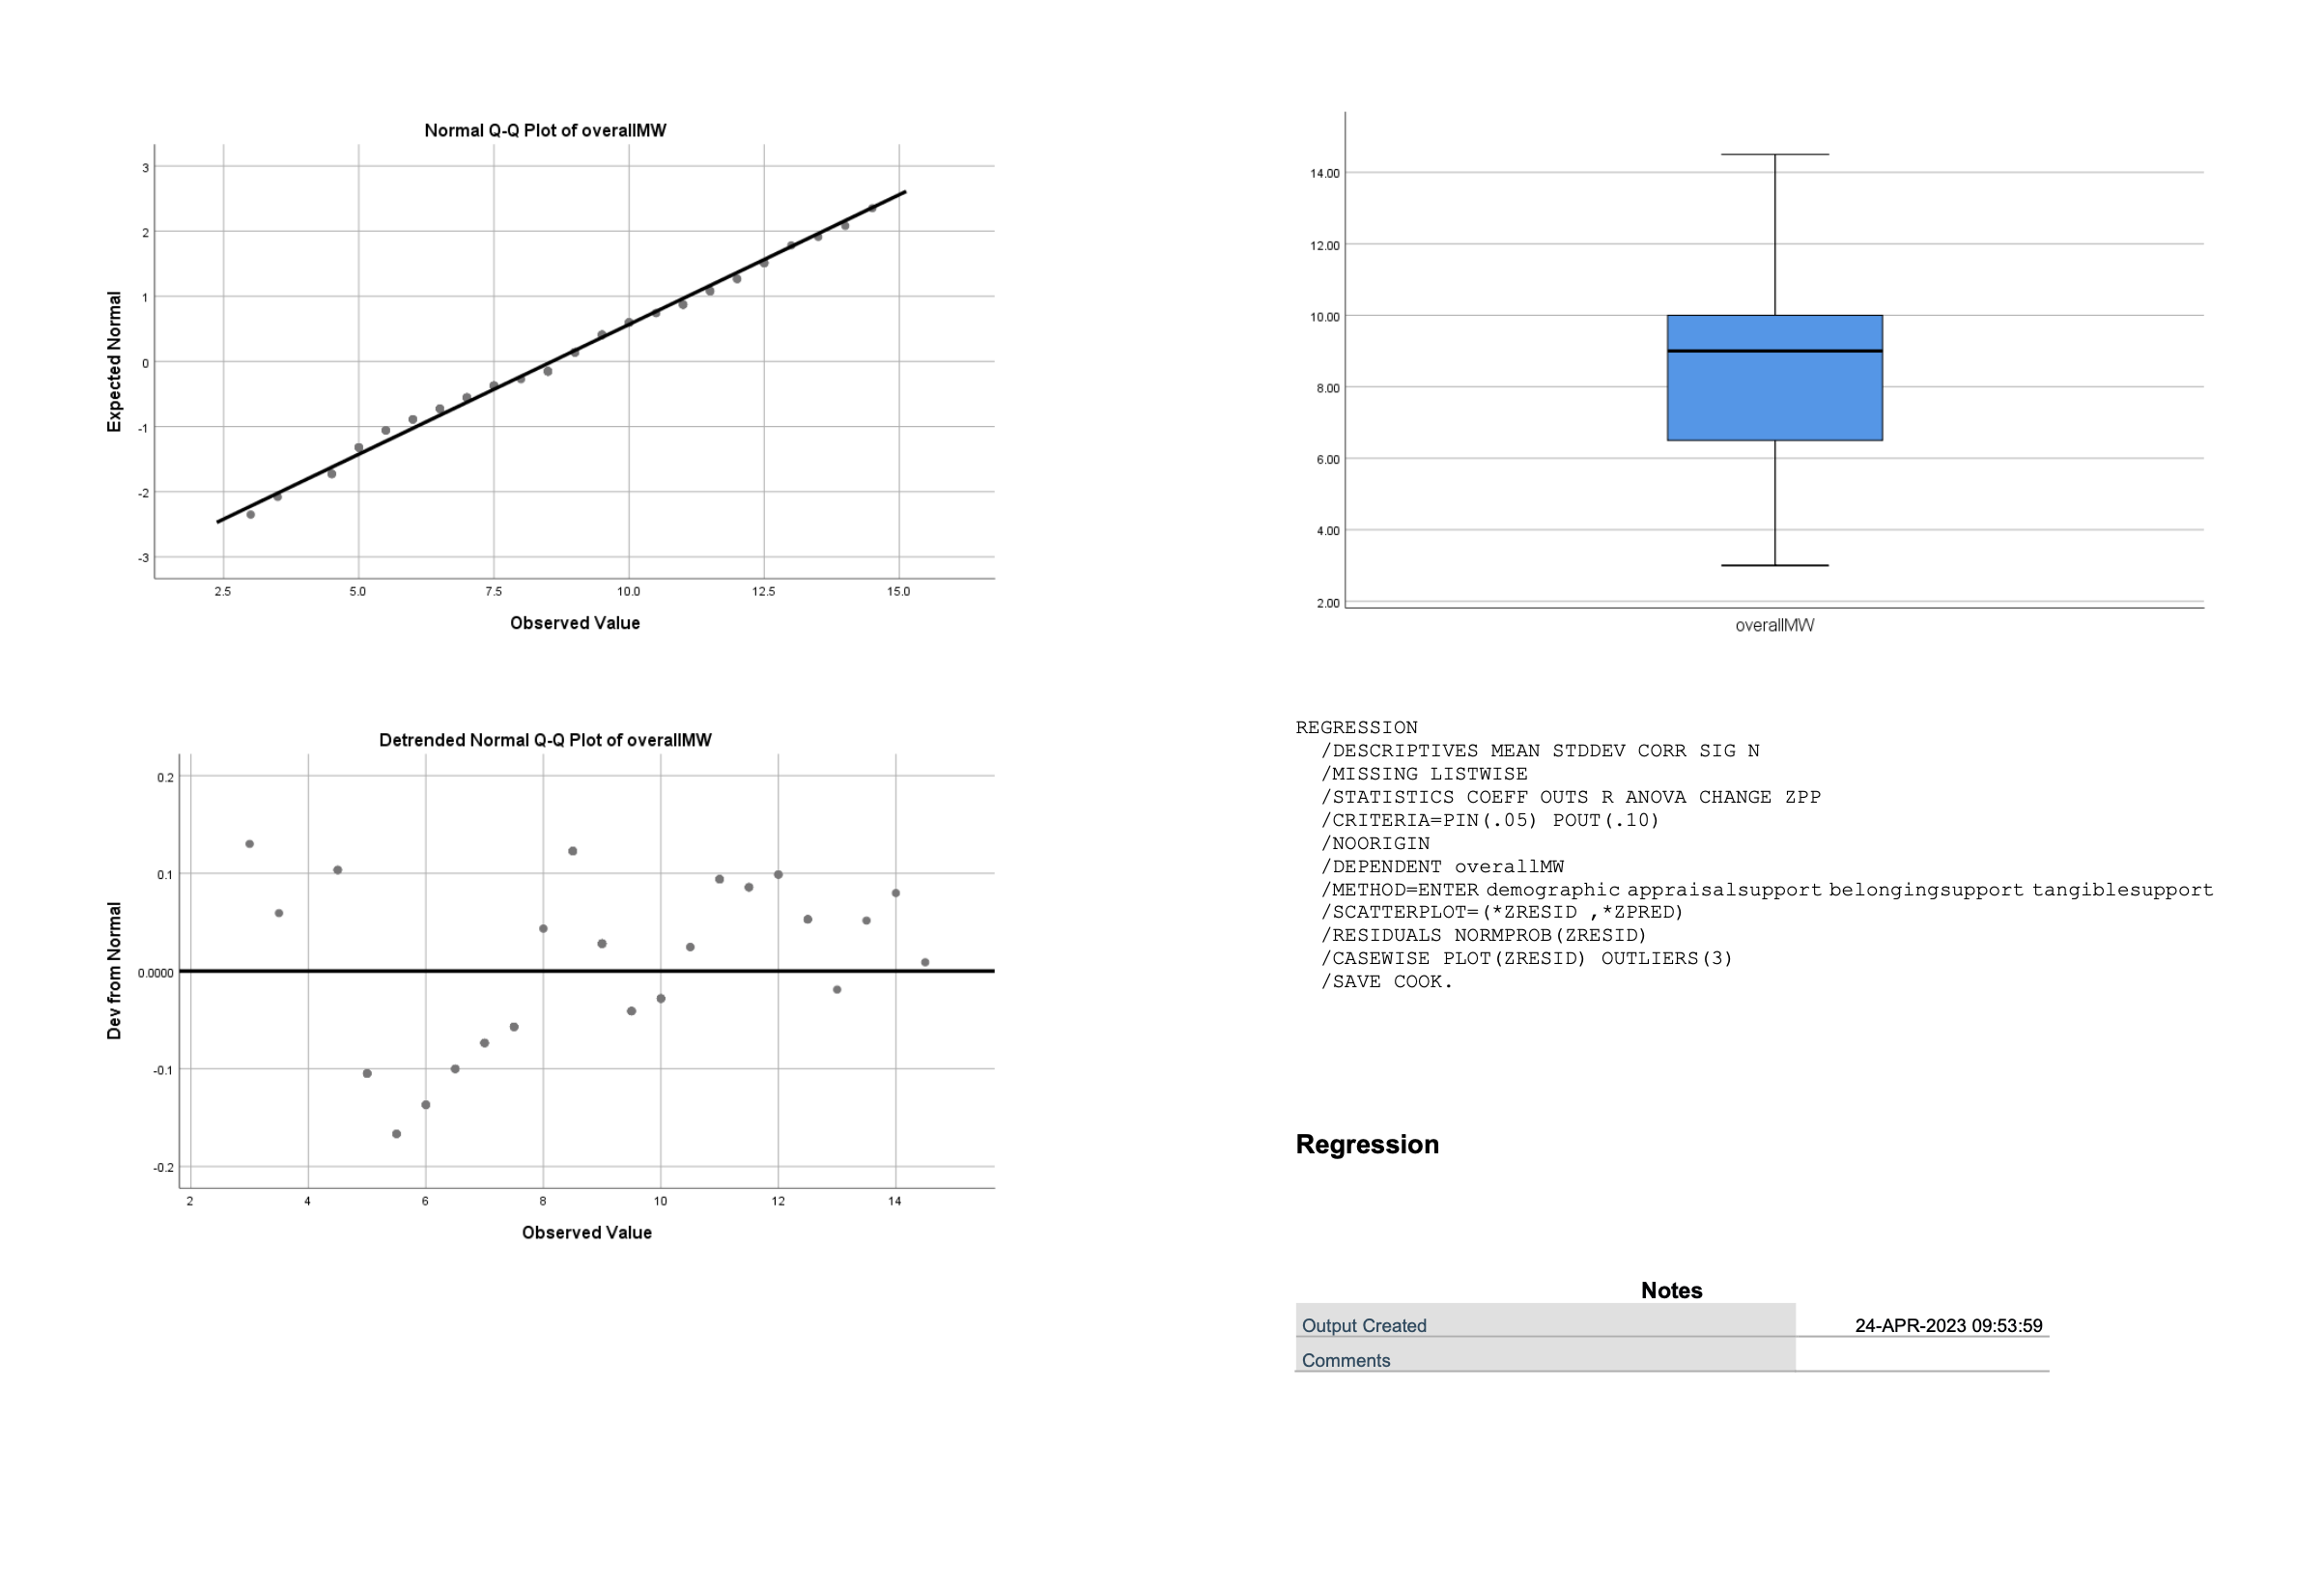
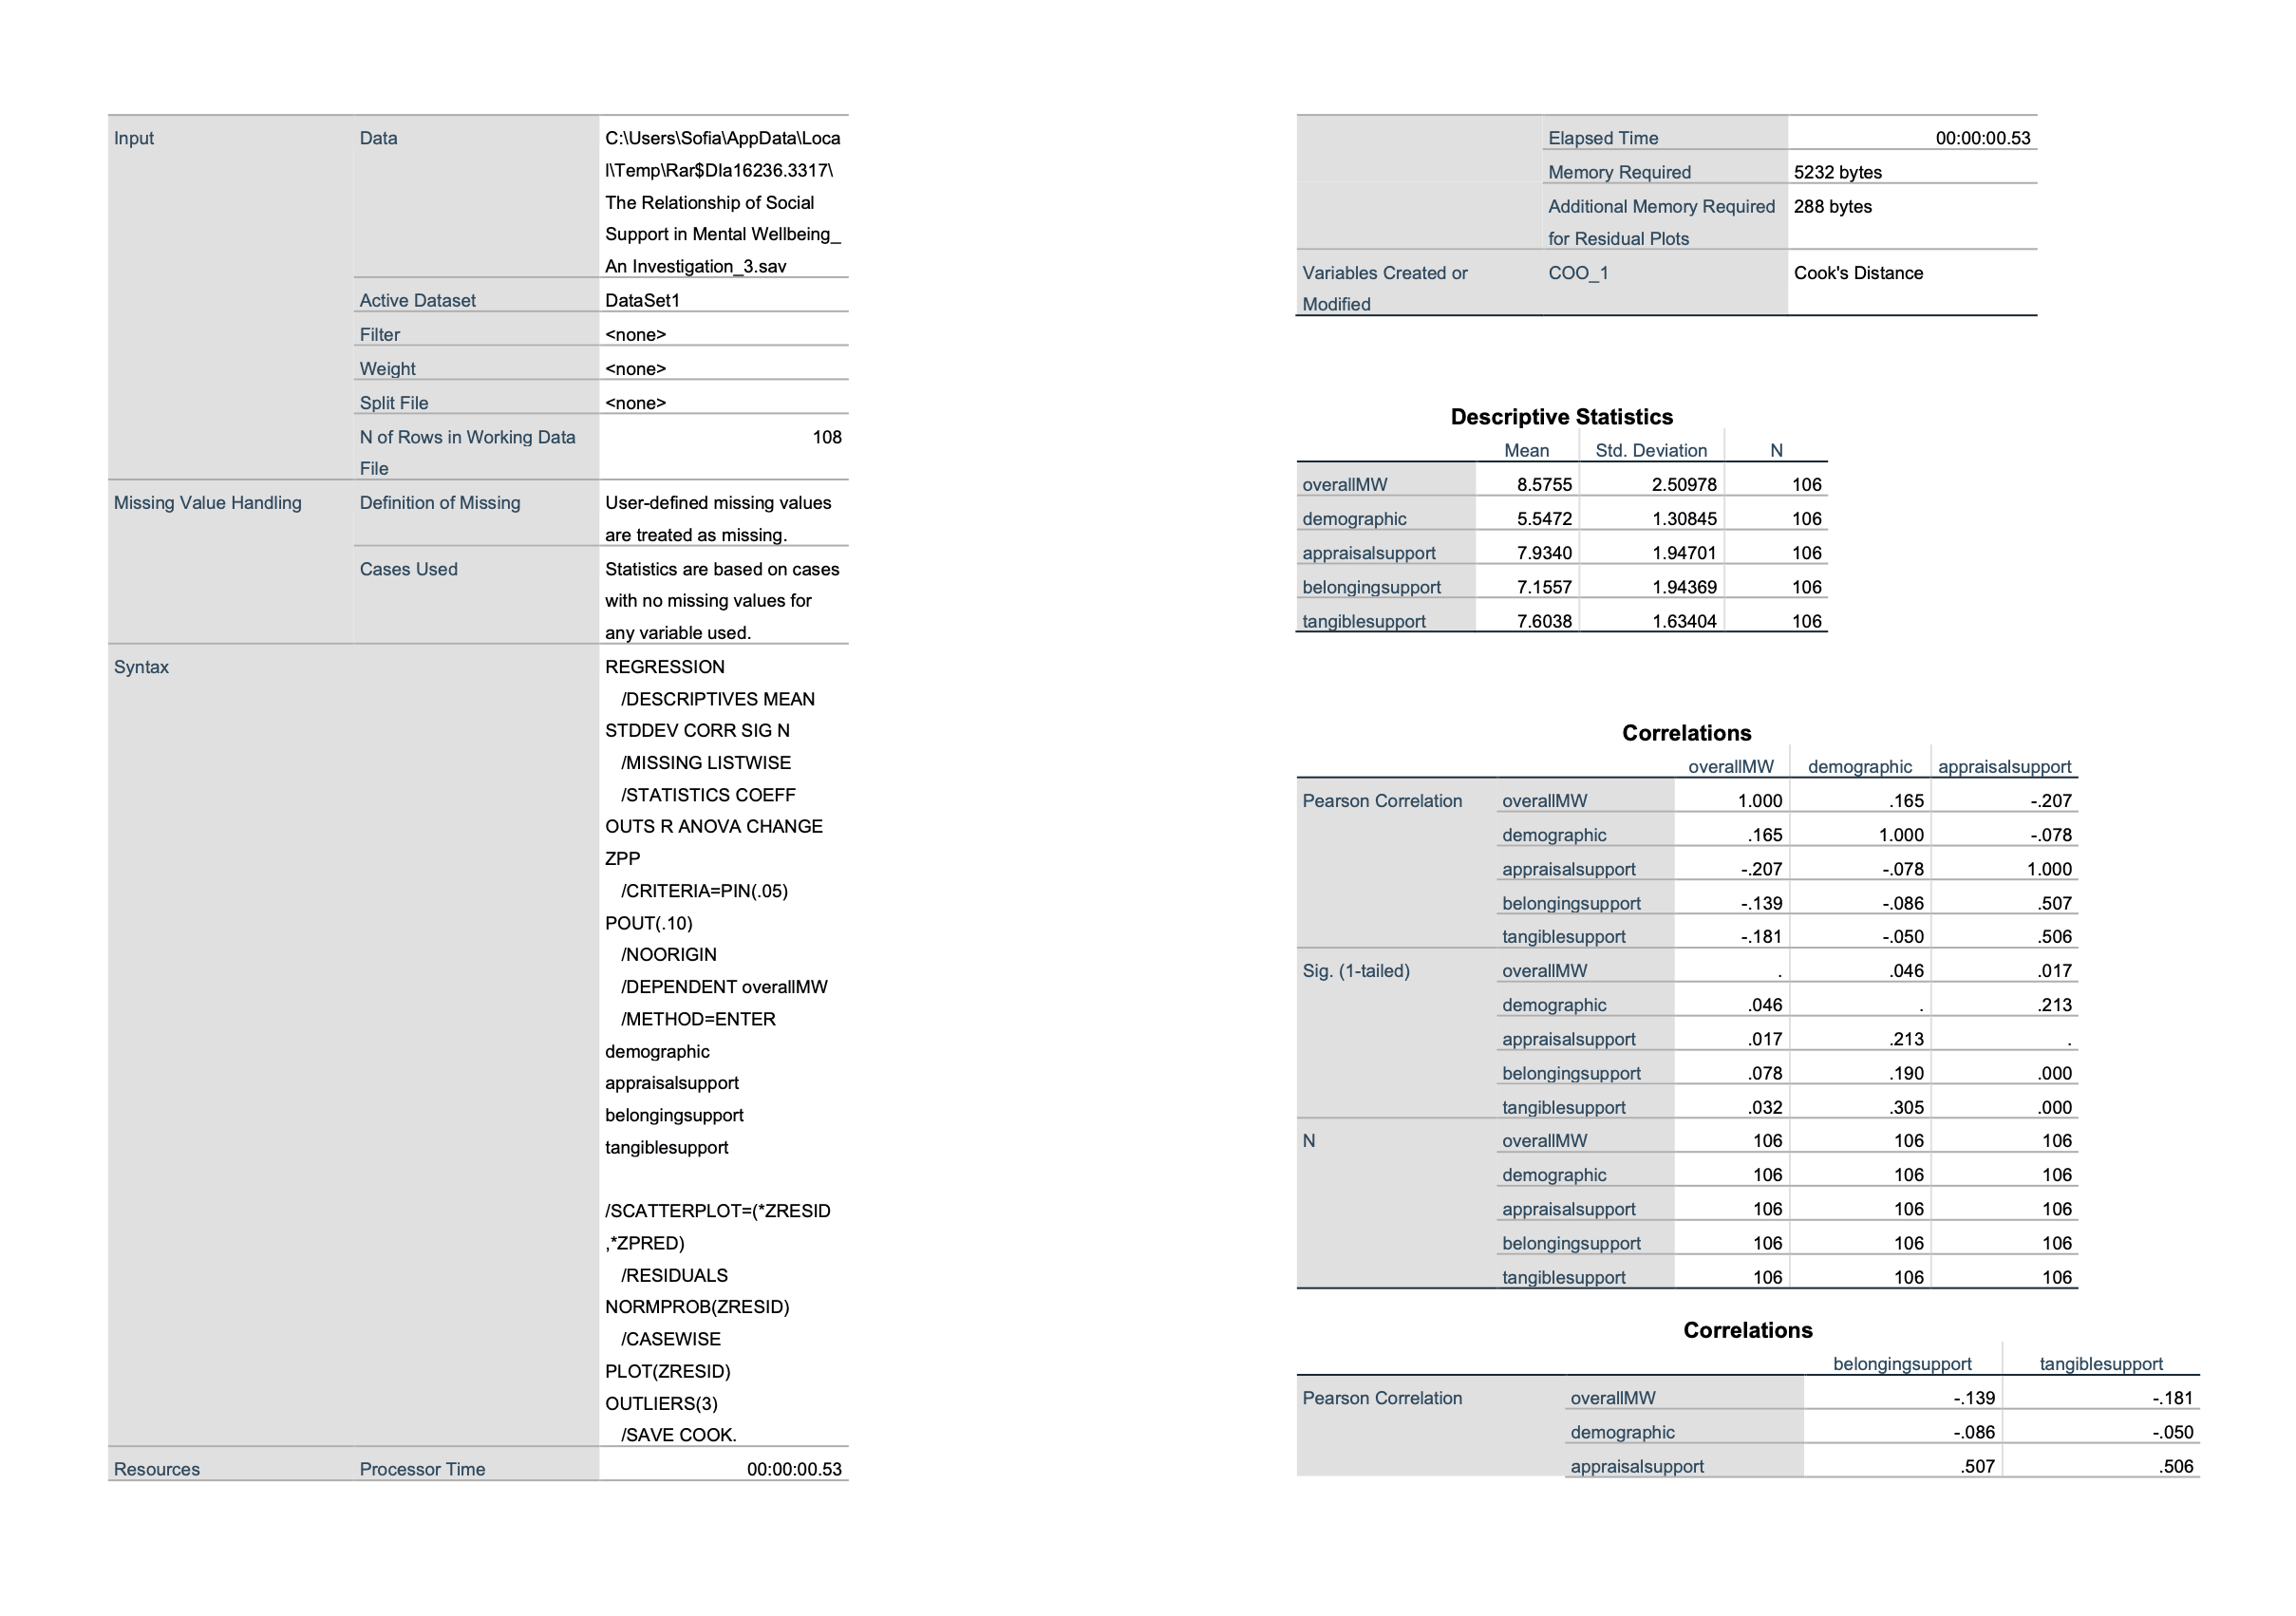
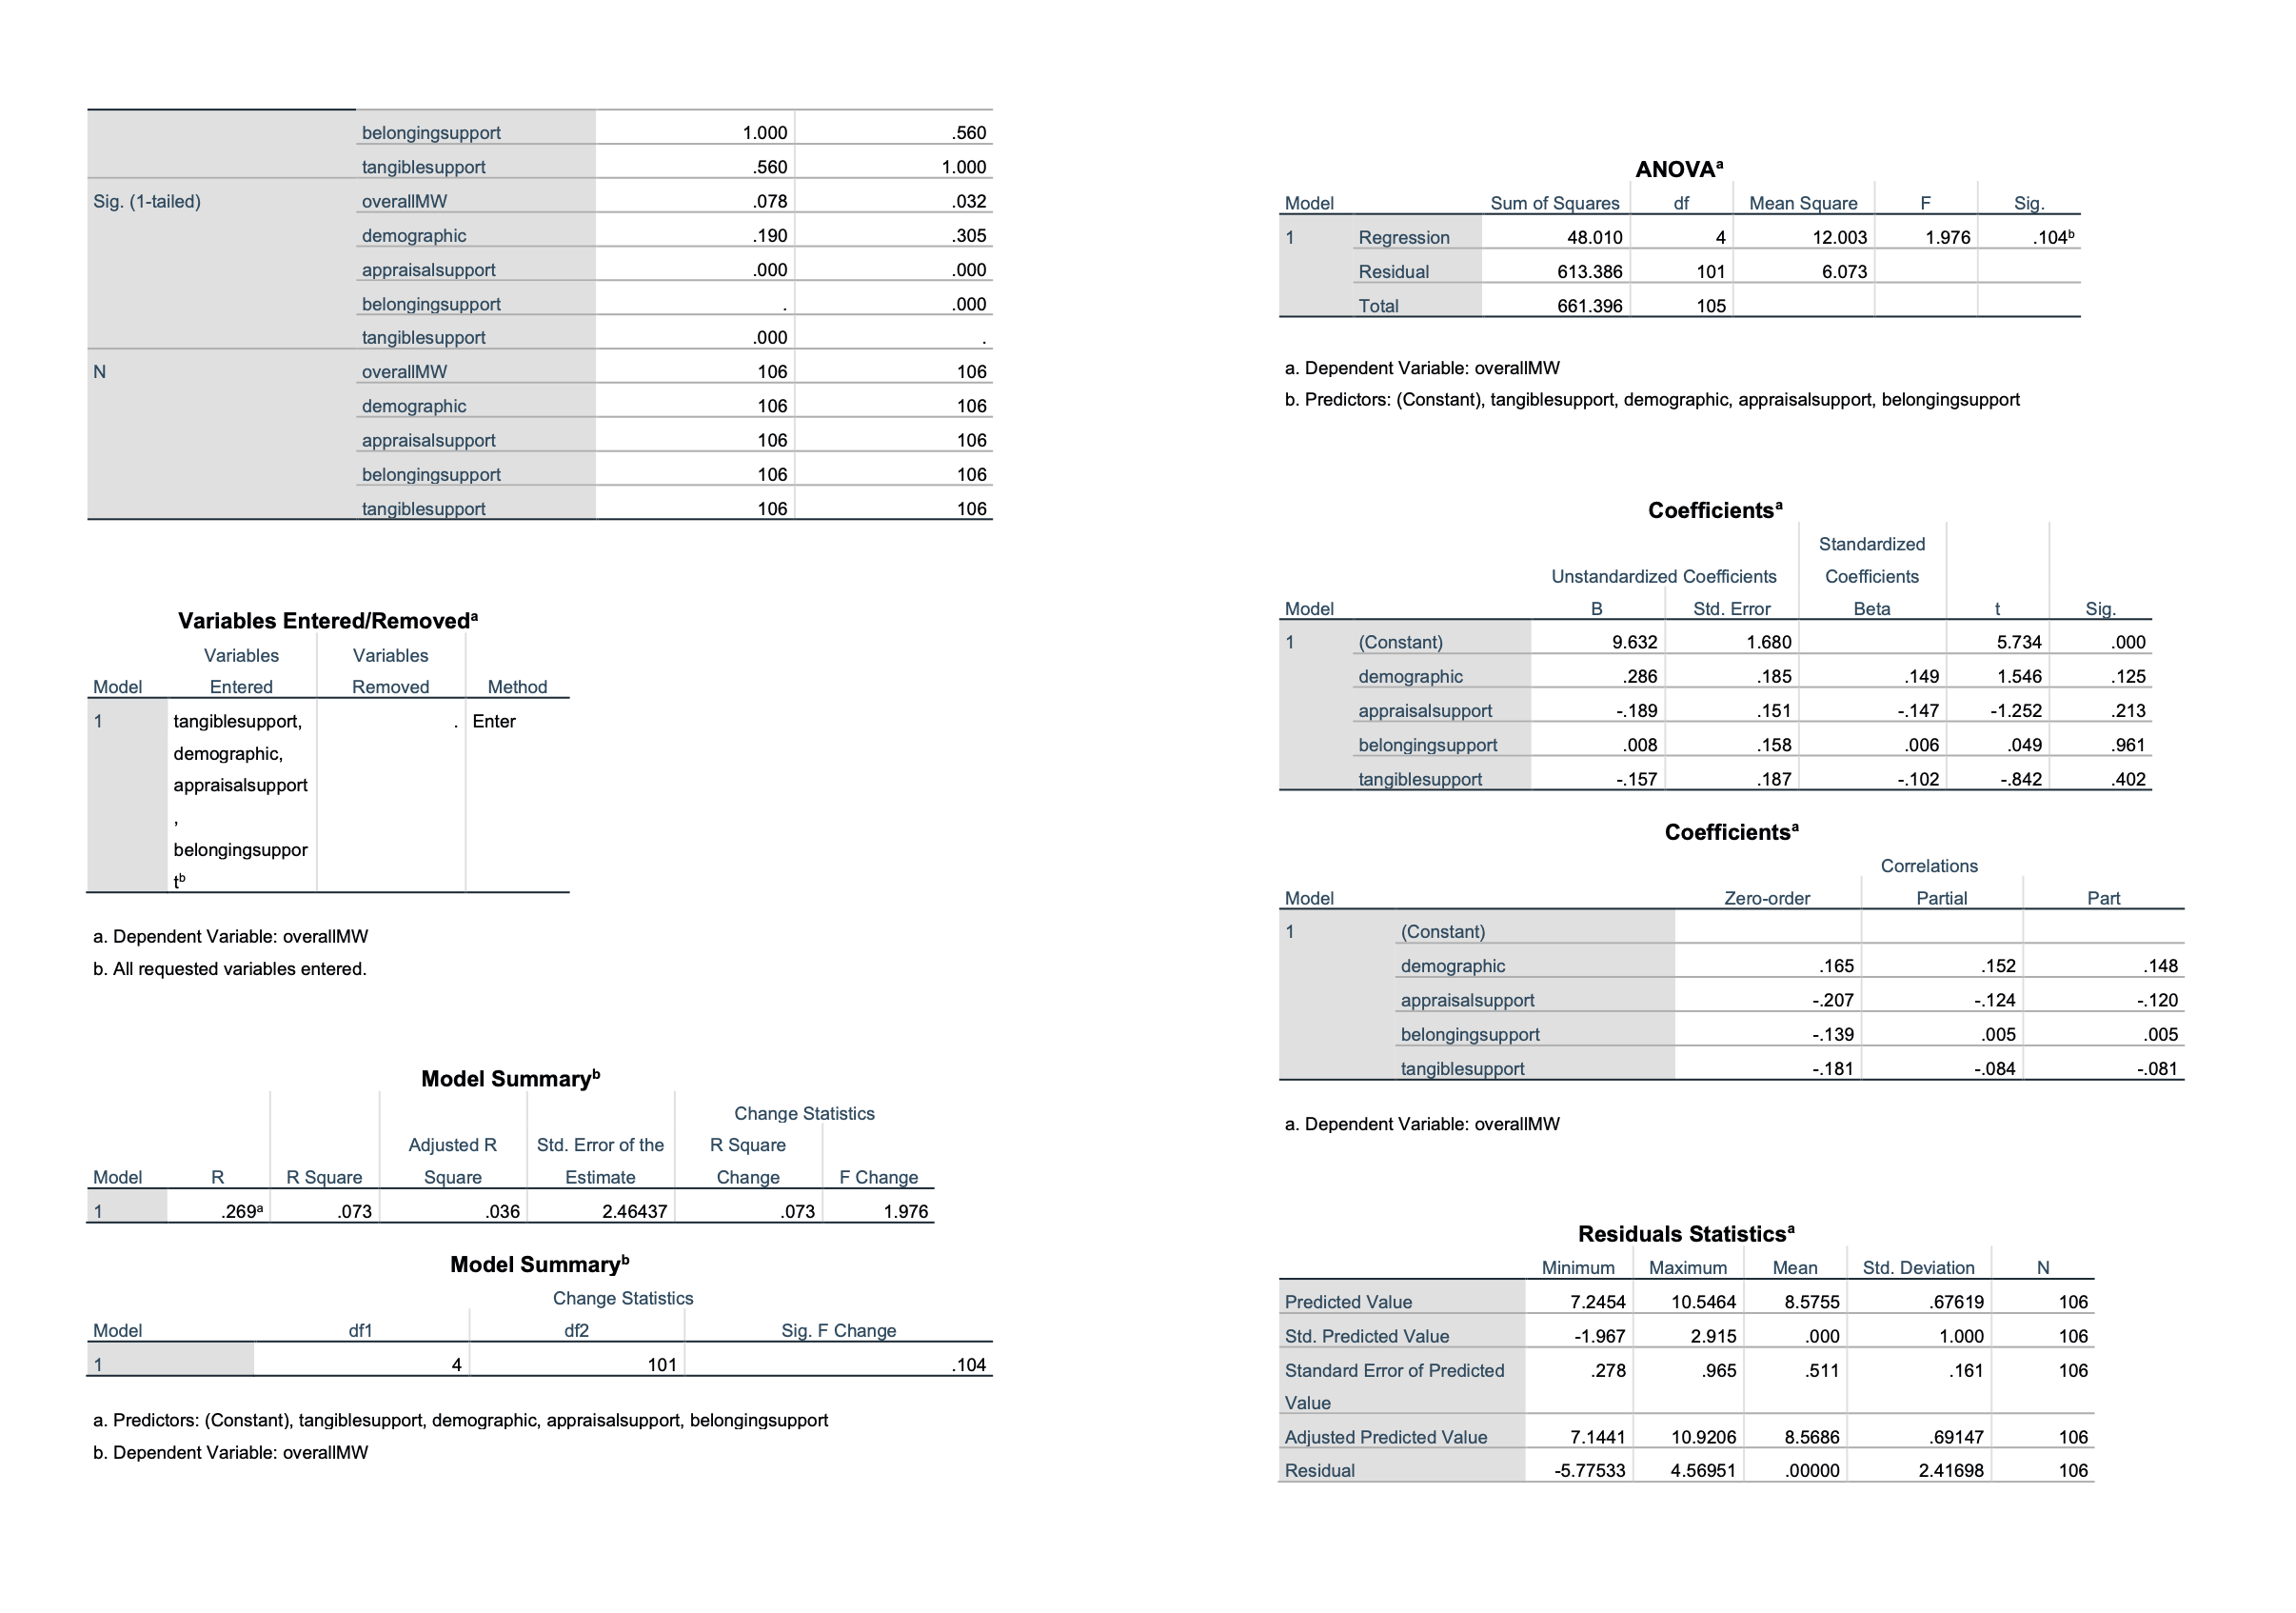
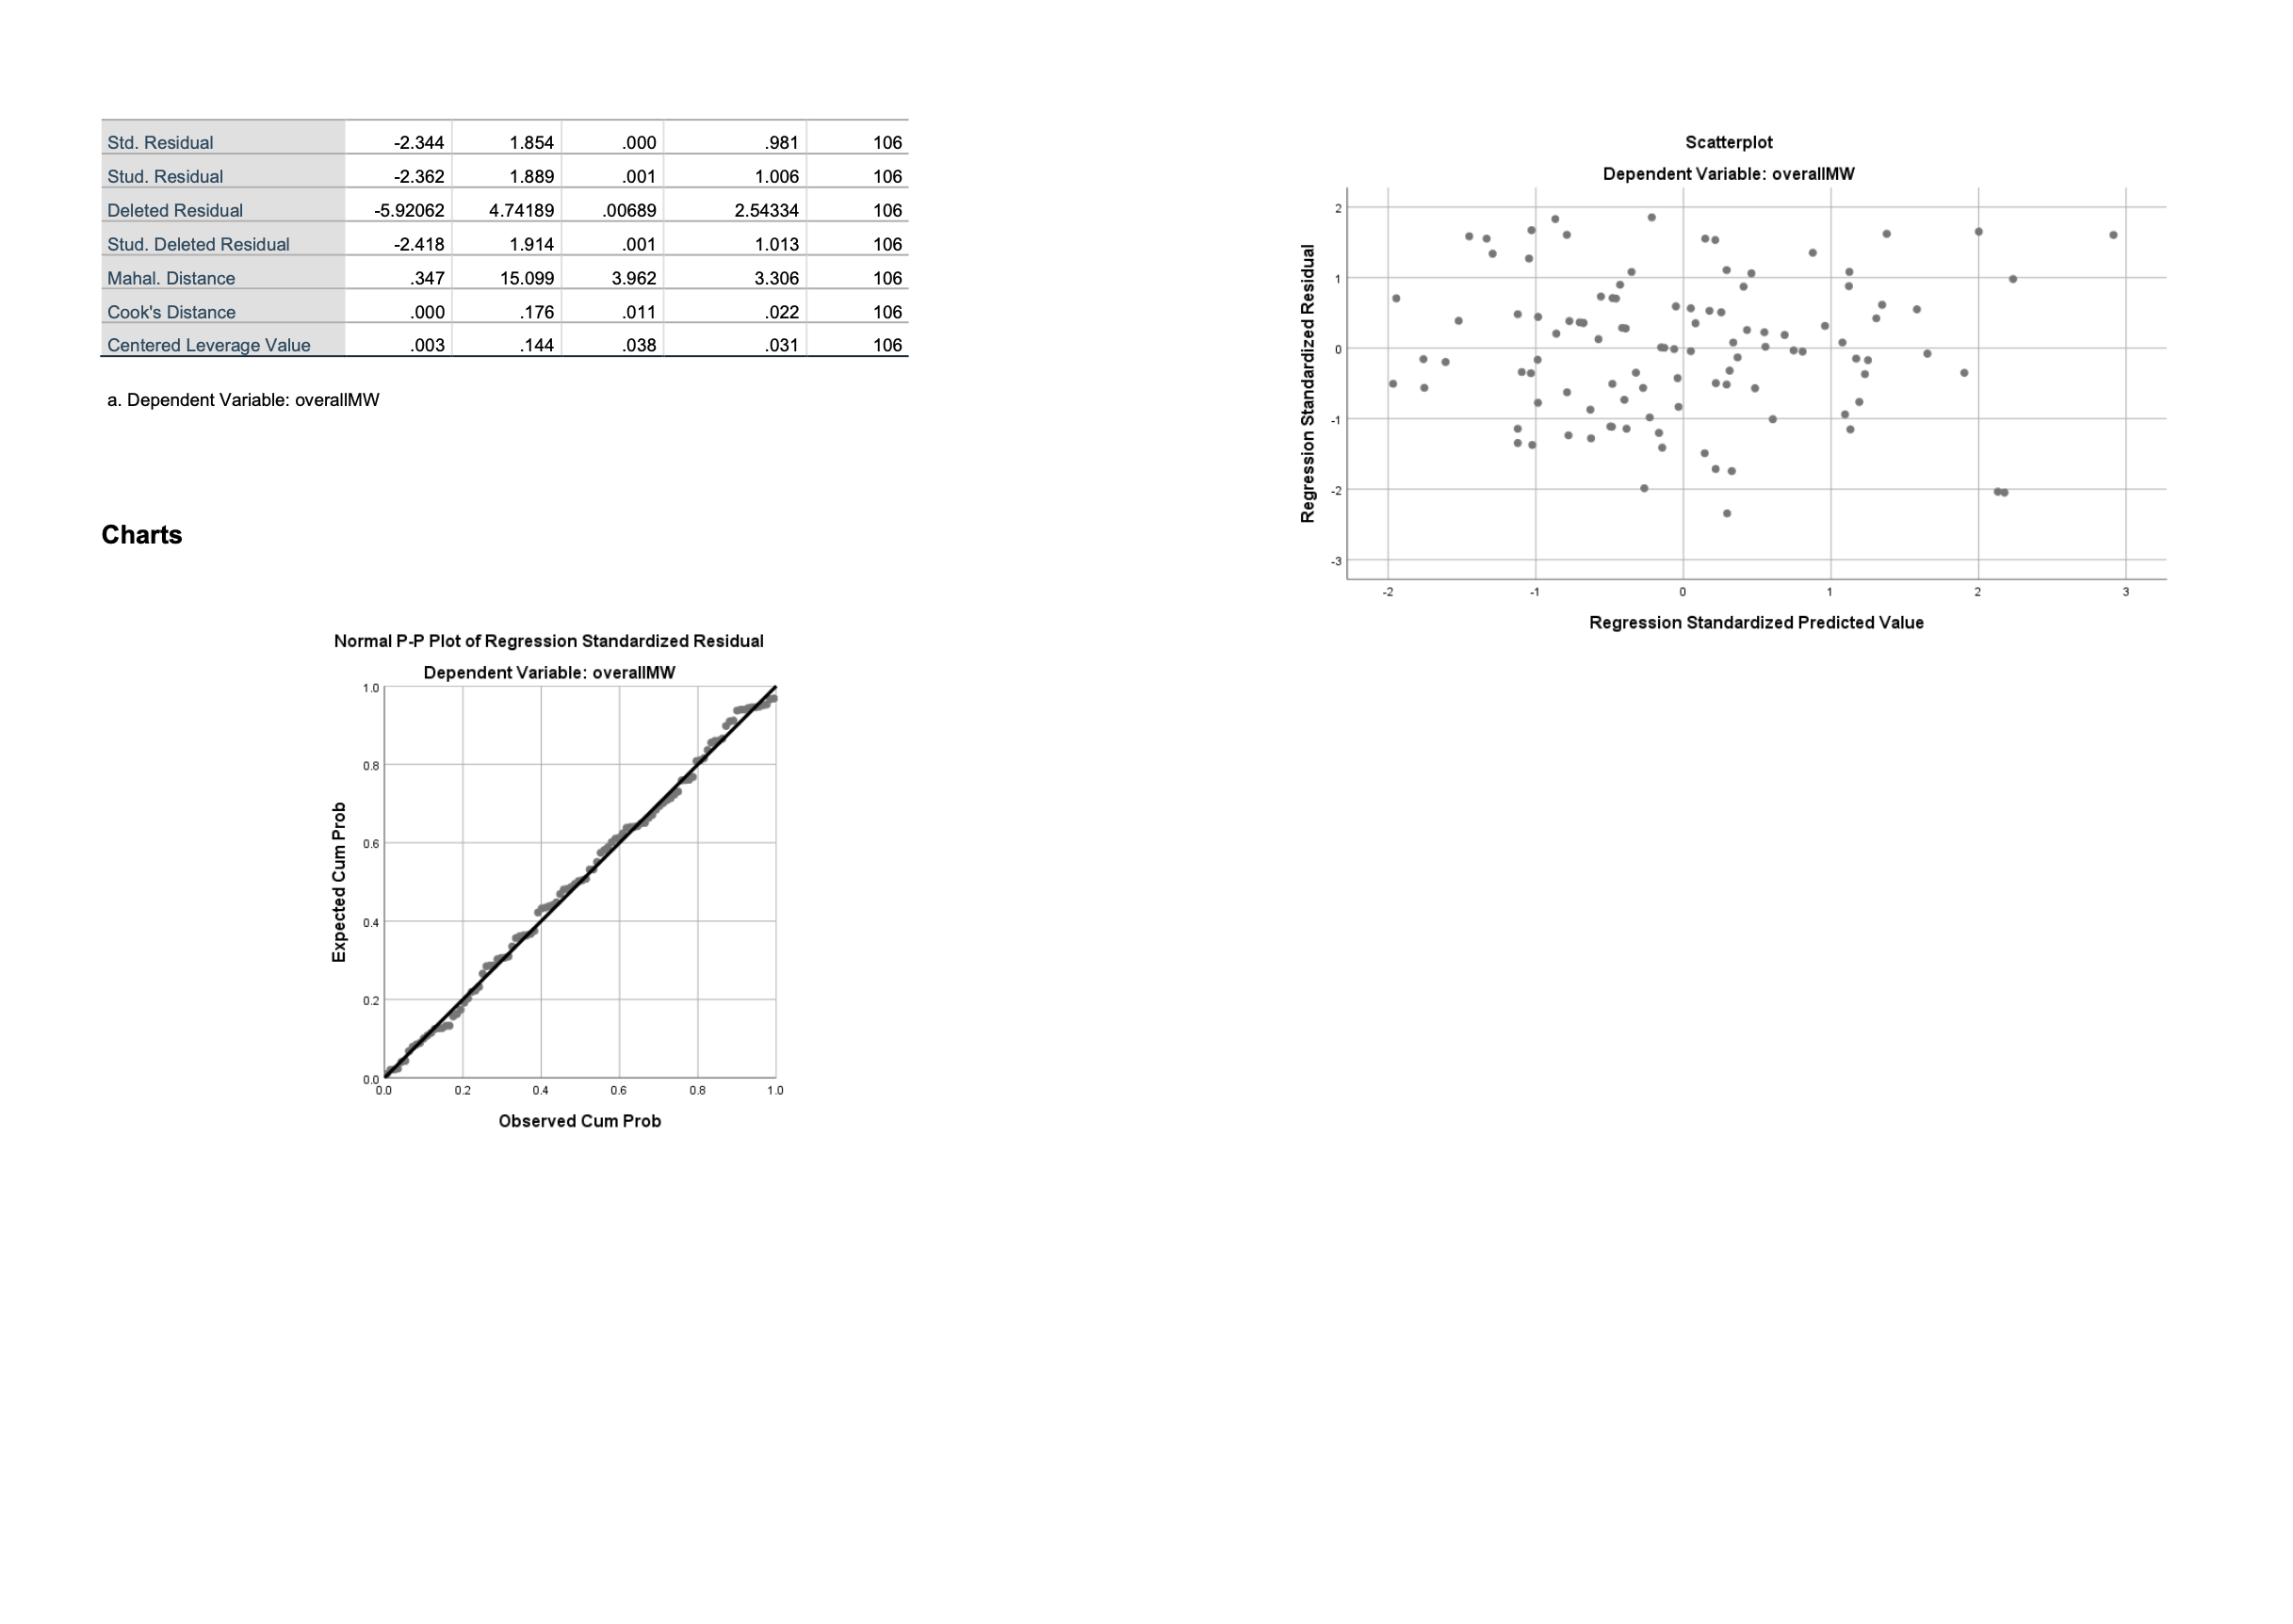
Missing Value Handling Syntax Definition of Missing Cases Used User-defined missing values for dependent variables are treated as missing. Statistics are based on cases with no missing values for any dependent variable or factor used. EXAMINE VARIABLES=overallMW /PLOT BOXPLOT HISTOGRAM NPPLOT /COMPARE GROUPS /STATISTICS DESCRIPTIVES /CINTERVAL 95 /MISSING LISTWISE /NOTOTAL. Skewness Kurtosis Tests of Normality .045 .235 -.570 .465 Kolmogorov-Smirnova Statistic df Sig. Statistic Shapiro-Wilk df Sig. overallMW .092 106 .028 .984 106 .214 a. Lilliefors Significance Correction overallMW Resources Processor Time Elapsed Time Case Processing Summary 00:00:00.50 20 00:00:00.60 Valid Cases Missing Total N Percent N Percent N Percent overallMW 106 98.1% 2 1.9% 108 100.0% Descriptives Statistic Std. Error overallMW Mean 95% Confidence Interval for Mean Lower Bound 8.5755 8.0921 .24377 Upper Bound 9.0588 5% Trimmed Mean 8.5577 Median 9.0000 Variance Std. Deviation 6.299 2.50978 Minimum 3.00 Maximum 14.50 Range 11.50 Interquartile Range 3.50 Frequency 5 15 Histogram 4.00 6.00 8.00 10.00 12.00 14.00 overallMW Mean = 8.58 Std. Dev. 2.51 N=106 Dev from Normal Expected Normal -2 0.2 0.1 0.0000 -0.1 -0.2 3 Normal Q-Q Plot of overallMW 14.00 12.00 10.00 8.00 6.00 4.00 2.5 5.0 7.5 10.0 12.5 15.0 2.00 Observed Value Detrended Normal Q-Q Plot of overallMW 2 4 6 8 Observed Value 10 12 14 overallMW REGRESSION /DESCRIPTIVES MEAN STDDEV CORR SIG N /MISSING LISTWISE /STATISTICS COEFF OUTS R ANOVA CHANGE ZPP /CRITERIA PIN (.05) POUT (.10) /NOORIGIN /DEPENDENT overallMW /METHOD=ENTER demographic appraisalsupport belongingsupport tangiblesupport /SCATTERPLOT= (*ZRESID, *ZPRED) /RESIDUALS NORMPROB (ZRESID) /CASEWISE PLOT (ZRESID) OUTLIERS (3) /SAVE COOK. Regression Output Created Comments Notes 24-APR-2023 09:53:59 Input Data Missing Value Handling Syntax Resources Active Dataset Filter C:\Users\Sofia\AppData\Loca I\Temp\Rar$Dla16236.3317\ The Relationship of Social Support in Mental Wellbeing_ An Investigation_3.sav DataSet1 Variables Created or Modified Weight Split File N of Rows in Working Data File Definition of Missing Cases Used Elapsed Time Memory Required 00:00:00.53 5232 bytes Additional Memory Required 288 bytes for Residual Plots COO_1 Descriptive Statistics Cook's Distance User-defined missing values are treated as missing. 108 Mean Std. Deviation N overallMW demographic 8.5755 2.50978 106 5.5472 1.30845 106 appraisalsupport 7.9340 1.94701 106 belongingsupport 7.1557 1.94369 106 tangiblesupport 7.6038 1.63404 106 Statistics are based on cases with no missing values for any variable used. REGRESSION /DESCRIPTIVES MEAN STDDEV CORR SIG N /MISSING LISTWISE /STATISTICS COEFF OUTS R ANOVA CHANGE ZPP /CRITERIA PIN(.05) POUT(.10) /NOORIGIN /DEPENDENT overallMW /METHOD=ENTER Pearson Correlation Sig. (1-tailed) demographic appraisalsupport belongingsupport tangiblesupport Processor Time /SCATTERPLOT=(*ZRESID ,*ZPRED) /RESIDUALS NORMPROB(ZRESID) /CASEWISE PLOT(ZRESID) OUTLIERS(3) /SAVE COOK. 00:00:00.53 Correlations overallMW demographic appraisalsupport overallMW 1.000 .165 -.207 demographic .165 1.000 -.078 appraisalsupport -.207 -.078 1.000 belongingsupport -.139 -.086 .507 tangiblesupport -.181 -.050 .506 overallMW .046 .017 demographic .046 .213 appraisalsupport .017 .213 belongingsupport .078 .190 .000 tangiblesupport .032 .305 .000 N overallMW 106 106 106 demographic 106 106 106 appraisalsupport 106 106 106 belongingsupport 106 106 106 tangiblesupport 106 106 106 Correlations belongingsupport tangiblesupport Pearson Correlation overallMW demographic -.139 -.181 -.086 -.050 appraisalsupport .507 .506 belongingsupport 1.000 .560 tangiblesupport .560 1.000 ANOVAa Sig. (1-tailed) overallMW .078 .032 Model Sum of Squares df Mean Square F Sig. demographic .190 .305 1 Regression 48.010 4 12.003 1.976 .104b appraisalsupport .000 .000 Residual 613.386 101 6.073 belongingsupport .000 Total 661.396 105 tangiblesupport .000 N overallMW 106 106 demographic 106 106 a. Dependent Variable: overallMW b. Predictors: (Constant), tangiblesupport, demographic, appraisalsupport, belongingsupport appraisalsupport 106 106 belongingsupport 106 106 tangiblesupport 106 106 Variables Entered/Removeda Variables Variables Model Entered Removed Method 1 tangiblesupport, Enter demographic, appraisalsupport belongingsuppor tb a. Dependent Variable: overallMW b. All requested variables entered. Model Summaryb Adjusted R Std. Error of the Model R R Square Square Estimate 1 .269a .073 .036 2.46437 Change Statistics R Square Change F Change .073 1.976 Coefficientsa Unstandardized Coefficients Model B Std. Error Standardized Coefficients Beta t Sig. 1 (Constant) 9.632 1.680 5.734 .000 demographic .286 .185 .149 1.546 .125 appraisalsupport -.189 .151 -.147 -1.252 .213 belongingsupport .008 .158 .006 .049 .961 tangiblesupport -.157 .187 -.102 -.842 .402 Coefficientsa Model 1 (Constant) demographic appraisalsupport belongingsupport tangiblesupport a. Dependent Variable: overallMW Zero-order Correlations Partial Part .165 .152 .148 -.207 -.124 -.120 -.139 .005 .005 -.181 -.084 -.081 Residuals Statisticsa Model Summaryb Minimum Maximum Mean Std. Deviation N Change Statistics Predicted Value 7.2454 Model 1 df1 df2 Sig. F Change Std. Predicted Value -1.967 4 101 .104 Standard Error of Predicted Value .278 10.5464 2.915 .965 8.5755 .000 .67619 1.000 106 106 .511 .161 106 a. Predictors: (Constant), tangiblesupport, demographic, appraisalsupport, belongingsupport b. Dependent Variable: overallMW Adjusted Predicted Value Residual 7.1441 -5.77533 10.9206 4.56951 8.5686 .00000 .69147 2.41698 106 106 Std. Residual Stud. Residual -2.344 1.854 .000 .981 106 -2.362 1.889 .001 1.006 106 Deleted Residual -5.92062 4.74189 .00689 2.54334 106 Stud. Deleted Residual -2.418 1.914 .001 1.013 106 Mahal. Distance .347 15.099 3.962 3.306 106 Cook's Distance .000 .176 .011 .022 106 Centered Leverage Value .003 .144 .038 .031 106 a. Dependent Variable: overallMW Charts Expected Cum Prob Normal P-P Plot of Regression Standardized Residual Dependent Variable: overallMW 0.4 0.2 0.8 1.0 0.0 0.0 0.2 0.4 0.6 Observed Cum Prob 0.8 1.0 Regression Standardized Residual -2 -1 Scatterplot Dependent Variable: overallMW 0 1 Regression Standardized Predicted Value 2 3
Step by Step Solution
There are 3 Steps involved in it

Get step-by-step solutions from verified subject matter experts