

Question: Model Summary Adjusted R Std. Error of Model R R Square Square the Estimate 1 .760 577 .559 5.69097 a. Predictors: (Constant), gender, age, heart_rate,
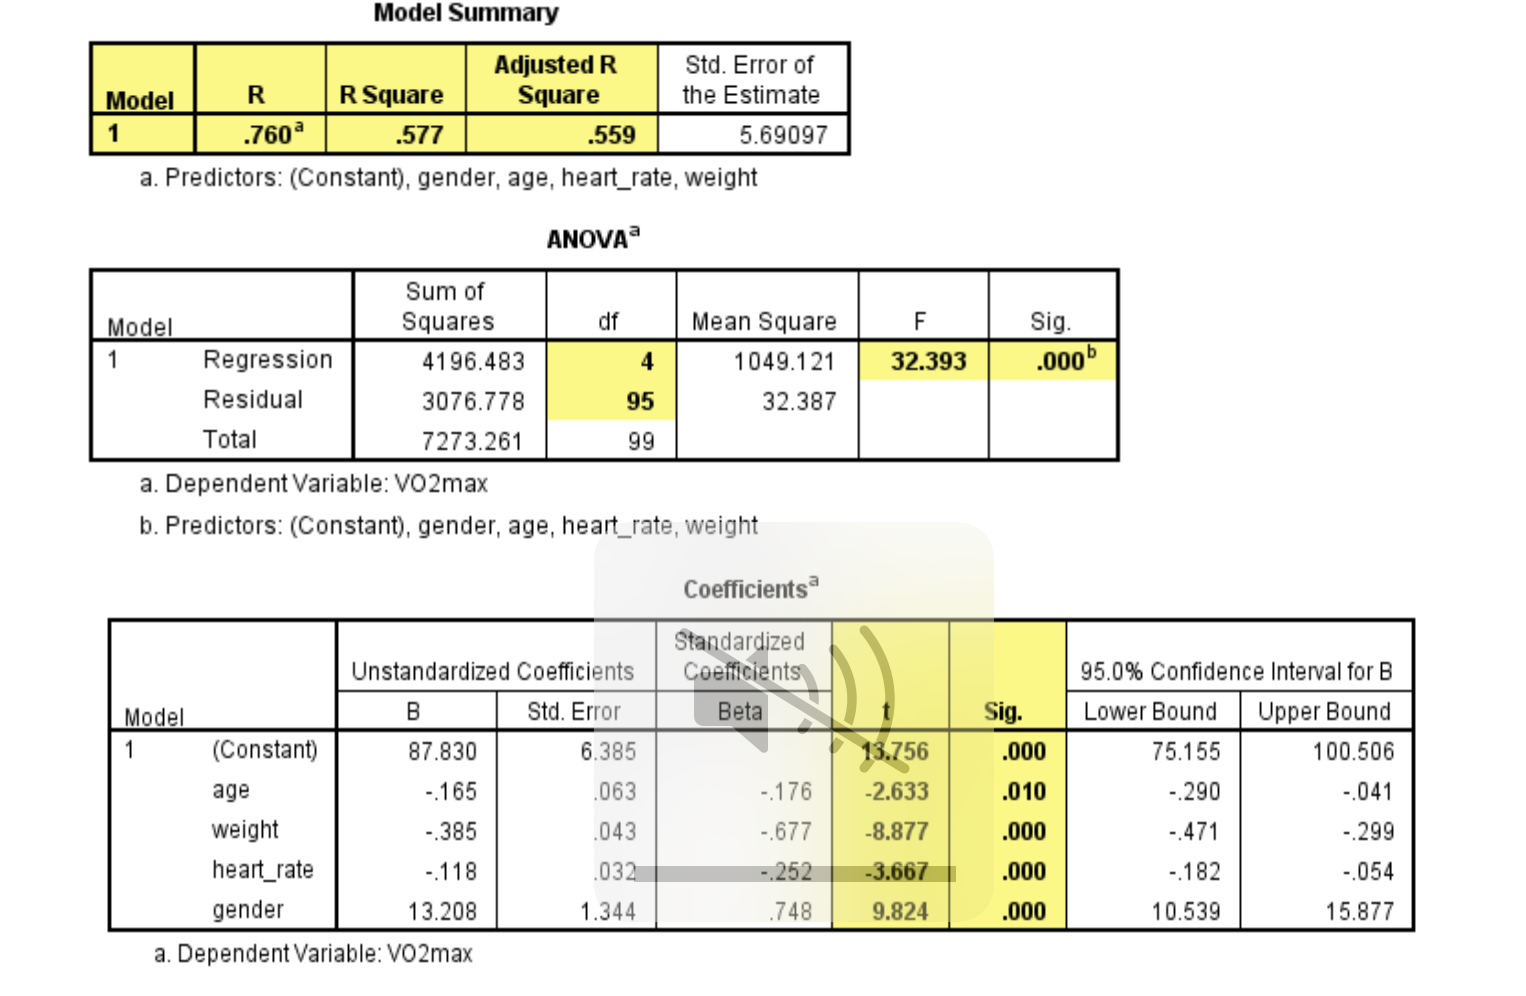
Model Summary Adjusted R Std. Error of Model R R Square Square the Estimate 1 .760 577 .559 5.69097 a. Predictors: (Constant), gender, age, heart_rate, weight ANOVA Sum of Model Squares df Mean Square F Sig. Regression 4196.483 1049.121 32.393 .000 Residual 3076.778 95 32.387 Total 7273.261 99 a. Dependent Variable: VO2max b. Predictors: (Constant), gender, age, heart_rate, weight Coefficients Standardized Unstandardized Coefficients Coefficients 95.0% Confidence Interval for B Model B Std. Error Beta Sig. Lower Bound Upper Bound (Constant) 87.830 6.385 13.756 000 75.155 100.506 age -.165 .063 -.176 -2.633 .010 -.290 ..041 weight -.385 .043 ..677 -8.877 .000 -.471 -.299 heart_rate -.118 .032 -.252 -3.667 .000 -.182 -.054 gender 13.208 1.344 .748 9.824 .000 10.539 15.877 a. Dependent Variable: VO2maxQuestions: 1. Explain how you can determine how well the model fits the data (i.e., explain the meaning of Coefficient of Determination in this Table) 2. Explain how you can test the validity of the model (i.e., explain how you will look up F-table to get the critical value of F at the significance level, 0.05 and determine the validity). 3. Explain how you can test the individual coefficients. (i.e., explain how you will look up t-table to get the critical value of t at the significance level, 0.01 and determine the statistical significance of individual variables). 4. Draw a conclusion of this model (i.e., interpret the results)
Step by Step Solution
There are 3 Steps involved in it

Get step-by-step solutions from verified subject matter experts