

Question: modelling and optimization Simply giving an answer not enough, formulae in Excel must be used when possible. When placing your answers into the spreadsheet file
modelling and optimization 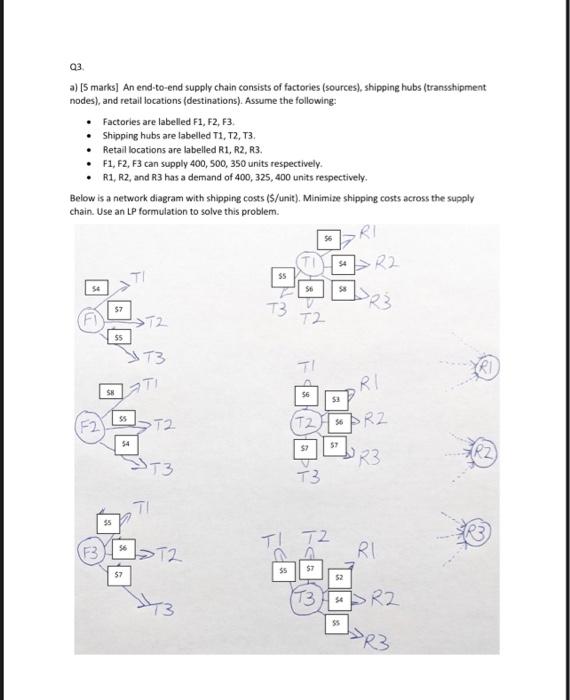
Simply giving an answer not enough, formulae in Excel must be used when possible. When placing your answers into the spreadsheet file use the sheets that are provided. Any text responses can be placed in text boxes within a respective sheet.
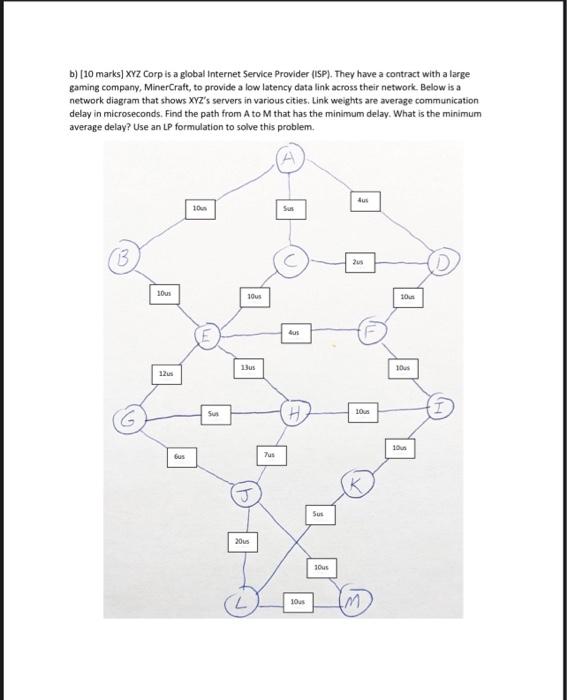
93 a) [5 marks) An end-to-end supply chain consists of factories (sources), shipping hubs (transshipment nodes), and retail locations (destinations). Assume the following: Factories are labelled F1, F2, F3 Shipping hubs are labelled T1, T2,13, Retail locations are labelled R1, R2, R3. F1, F2, F3 can supply 400, 500, 350 units respectively R1, R2, and R3 has a demand of 400, 325,400 units respectively. Below is a network diagram with shipping costs (s/unit). Minimize shipping costs across the supply chain. Use an LP formulation to solve this problem. $4 .R2 SS 56 T3 57 SR3 >T2 T2 55 T3 GRI SH 56 $3 S5 F2 12 so PR 2 $2 57 T3 R3 T3 I 55 TI T2 F3 > T2 RI 55 $7 57 52 (T3 T3 56 R2 DR3 b) [10 marks] XYZ Corp is a global Internet Service Provider (ISP). They have a contract with a large gaming company, MinerCraft, to provide a low latency data link across their network. Below is a network diagram that shows XYZ's servers in various cities. Link weights are average communication delay in microseconds. Find the path from A to M that has the minimum delay. What is the minimum average delay? Use an LP formulation to solve this problem. 10 Sus B 2us sous 10us 10 Aus 13us 10us 12us Sus H 10 10u bus 7us Sus 20 sous 10us 93 a) [5 marks) An end-to-end supply chain consists of factories (sources), shipping hubs (transshipment nodes), and retail locations (destinations). Assume the following: Factories are labelled F1, F2, F3 Shipping hubs are labelled T1, T2,13, Retail locations are labelled R1, R2, R3. F1, F2, F3 can supply 400, 500, 350 units respectively R1, R2, and R3 has a demand of 400, 325,400 units respectively. Below is a network diagram with shipping costs (s/unit). Minimize shipping costs across the supply chain. Use an LP formulation to solve this problem. $4 .R2 SS 56 T3 57 SR3 >T2 T2 55 T3 GRI SH 56 $3 S5 F2 12 so PR 2 $2 57 T3 R3 T3 I 55 TI T2 F3 > T2 RI 55 $7 57 52 (T3 T3 56 R2 DR3 b) [10 marks] XYZ Corp is a global Internet Service Provider (ISP). They have a contract with a large gaming company, MinerCraft, to provide a low latency data link across their network. Below is a network diagram that shows XYZ's servers in various cities. Link weights are average communication delay in microseconds. Find the path from A to M that has the minimum delay. What is the minimum average delay? Use an LP formulation to solve this problem. 10 Sus B 2us sous 10us 10 Aus 13us 10us 12us Sus H 10 10u bus 7us Sus 20 sous 10us
Step by Step Solution
There are 3 Steps involved in it
1 Expert Approved Answer
Step: 1 Unlock

Question Has Been Solved by an Expert!
Get step-by-step solutions from verified subject matter experts
Step: 2 Unlock
Step: 3 Unlock