

Question: Modelling the U.S. Population To effectively plan for the future one must attempt to predict the future. Government agencies use data about the past to

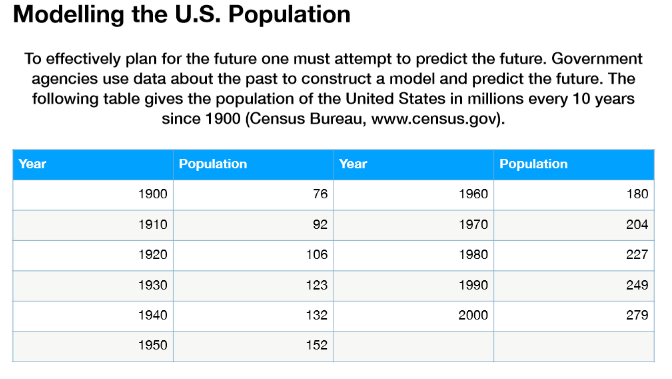

Modelling the U.S. Population To effectively plan for the future one must attempt to predict the future. Government agencies use data about the past to construct a model and predict the future. The following table gives the population of the United States in millions every 10 years since 1900 (Census Bureau, www.census.gov). Year Population Year Population 1900 76 1960 180 1910 92 1970 204 1920 106 1980 227 1930 123 1990 249 1940 132 2000 279 1950 152a) Draw a bar graph of the data in the accompanying table. Use a computer graphics program if one is available. (You can use excel or numbers. The scale, presentation and the amount of information shown will matter.). b) Enter the data into your calculator and use exponential regression to find an exponential model of the form y = ab* , where x = 0 corresponds to 1900. (You need to show the steps you follow on the calculator: Make a video or a slideshow of pictures or give an effective verbal description of the steps) ( You can google regression
Step by Step Solution
There are 3 Steps involved in it

Get step-by-step solutions from verified subject matter experts