

Question: Moderately Below Average Slightly Below Average About Average Slightly Above Average Moderately above Average Extreme] Above Avera - e a. Complete the tables by computing
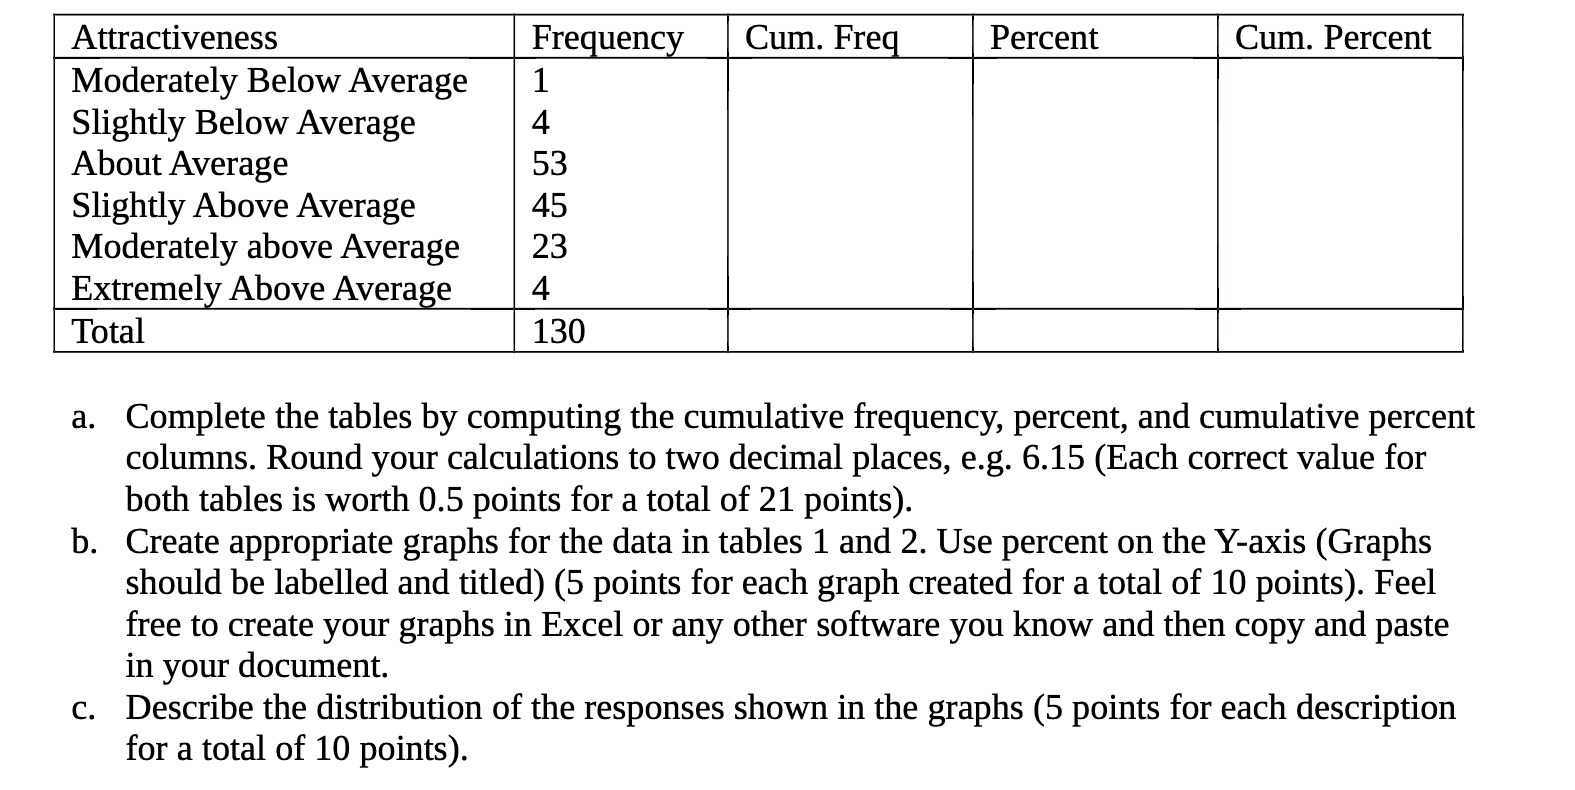
Moderately Below Average Slightly Below Average About Average Slightly Above Average Moderately above Average Extreme] Above Avera - e a. Complete the tables by computing the cumulative frequency, percent, and cumulative percent colunms. Round your calculations to two decimal places, e.g. 6.15 (Each correct value for both tables is worth 0.5 points for a total of 21 points). b. Create appropriate graphs for the data in tables 1 and 2. Use percent on the Y-axis (Graphs should be labelled and titled) (5 points for each graph created for a total of 10 points). Feel free to create your graphs in Excel or any other software you know and then copy and paste in your document. c. Describe the distribution of the responses shown in the graphs (5 points for each description for a total of 10 points)
Step by Step Solution
There are 3 Steps involved in it

Get step-by-step solutions from verified subject matter experts