Please answer all questions and fill in all spaces/tables.

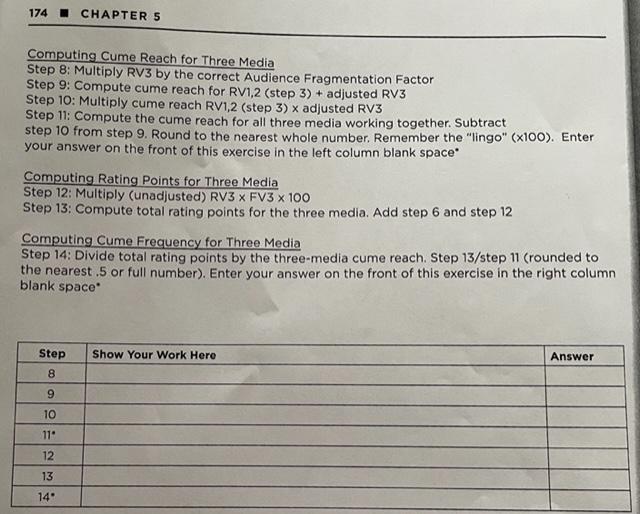
Exercise 5C: Modified Sainsbury Method for Estimating Spot Market Reach and Frequency Revisit the instructions for the Modified Sainsbury Method starting on page 151 and compute the Cume Reach and Frequency achieved in Cincinnati when local radio is added to the national media plan in April. Use the worksheet tables and enter your answers in the four blanks immedi- ately below Note: RV1 means Reach for Vehicle #1. FV1 means Frequency for Vehicle #1. Media Plan Facts Media Vehicle #1 National Television #2 National Magazine #3 Cincinnati Radio National R&F (from steps 3 & 7) Cincinnati R&F. (from steps 11 & 14) APRIL Reach Frequency 55 4 29 45 50 3 Computing Cume Reach for Two Media Step 1: Add RV1- RV2 Step 2: Multiply RVI X RV2 Step 3: Compute the reach of two media working together (RVL.2). Subtract step 2 from step 1. Round to the nearest whole number. Remember the "lingo" (x 100). Enter your answer above on the left column blank space'. Computing Rating Points for Two Media Step 4: Multiply RV1 x FV1x 100 Step 5: Multiply RV2 x FV2 x 100 Step 6: Compute total rating points for the first two media. Add step 4 and step 5. Computing Cume Frequency for Two Media Step 7: Divide total rating points by cume reach (rounded to the nearest .5 or full number). Enter your answer above in the right column blank space'. Show Your Work Here Answer Step 1 2 3* 4 5 6 7 174 CHAPTER 5 Computing Cume Reach for Three Media Step 8: Multiply RV3 by the correct Audience Fragmentation Factor Step 9: Compute cume reach for RV1,2 (step 3) + adjusted RV3 Step 10: Multiply cume reach RV1,2 (step 3) x adjusted RV3 Step 11: Compute the cume reach for all three media working together. Subtract step 10 from step 9. Round to the nearest whole number. Remember the "lingo" (x100). Enter your answer on the front of this exercise in the left column blank space Computing Rating Points for Three Media Step 12: Multiply (unadjusted) RV3 x FV3 x 100 Step 13: Compute total rating points for the three media. Add step 6 and step 12 Computing Cume Frequency for Three Media Step 14: Divide total rating points by the three-media cume reach. Step 13/step 11 (rounded to the nearest .5 or full number). Enter your answer on the front of this exercise in the right column blank space Show Your Work Here Step 8 Answer 9 10 12 13 149 THE RIGHT EXPOSURE LEVEL 151 Exhibit 5.6 shows the reach percentage for three different levels of ad exposure frequencies (1,8. and 5) that are produced by various rating point levels The Law of Diminishing Returns As with most things in business. there is a point at which or a path by which more dollars invest- ed will not yield the same return as previous dollars. In advertising exposure, there can be a point beyond which ad dollars are actually producing diminishing returns and are no longer effective This fattening effect is shown in Exhibit 56. The exhibit simply shows the fattening of the reach curve as more rating points are purchased and how the reach level goes down as the frequency of exposure goes up Notice that if an ad runs only one time, the curve flattens more than the 3+ ad exposure and the 5+ ad exposure. This is one of the immutable laws of nature in advertising Exhibit 5.6 Reach (% Adults 18-49) Reach, Frequency, and TRPS 100 90 1+Ad Exposures 80 3. 70 3+Ad 5xposures 60 50 40 5+Ad Exposures 30 20 10 3+ 0 0 250 500 1000 1250 1500 750 Total Rating Points The Modified Sainsbury Method for Estimating Cume Reach and Frequency from National and Local Media National brand media plans often have a national media umbrella component and another com- ponent for important spot markets like the Top 25. When the media plan uses only one national medium, like national television, it is relatively easy to estimate reach and frequency on a nation- al basis Further, it is assumed national media have geographical coverage matching the geographic distribution of the nation's population. The levels of reach and frequency achieved in any city in the country would be the same as the national levels of reach and frequency. In other words, if a national media plan were expected to deliver a reach of 70(%) and a frequency of 5 nationally, then it would be expected the reach and frequency in Cincinnati and San Diego to be the same. When two national media, like television and magazines, are used the estimation of reach and frequency becomes a little more complicated. When a local advertising medium is added to the 152 CHAPTER 5 national media mix it can become very difficult to estimate the cumulative reach and frequency achieved in individual spot markets. The Sainsbury Method is a way to quickly estimate the cumulative effect of national and local media on the reach and frequency achieved in a spot market. Lacking a sophisticated computer program, this method is adequate for purposes of understanding what happens to local reach and frequency levels when local media is added to a national media plan. To fully complete a Sainsbury reach and frequency projection, you should be familiar with the following equations and terminology: Rating Points/Cume Reach - Average Frequency Reach x Frequency = Rating Points RVI = Reach of media vehicle #1 FV1 = Frequency of media vehicle #1 Lingo = The custom in media is to express percentages as whole numbers. Therefore, a 65% reach is expressed as a reach of 65. The Audience Fragmentation Factors, which say every time you add a medium, you will also have diminishing returns and the less efficient each one becomes. Three of the benchmarks used in the industry are provided here: .90 for the 3rd medium only .85 for the 4th medium only .82 for the 5th medium only Example Media Plan Facts: Media Vehicle #1 National Television #2 National Magazine #3 Cincinnati Radio National R&F (From steps 3 & 7) Cincinnati R&F (Nat'l media only) MARCH Reach Frequency 42% 3 25 % 0 56 4 56 4 AIA OAW Sample Cume Reach and Frequency Worksheet Compute the Cume Reach and Frequency achieved in Cincinnati by the two national media used in March. Simply follow the steps in Exhibit 5.7 to get to the answer. 153 THE RIGHT EXPOSURE LEVEL Exhibit 5.7 Answer Step .67 1 .11 56 2 3 126 4 Show-Your-Work Column Computing Cume Reach for two Med Add RV RV2042 25) - 57 Muty RVI RV2 (4225) 11 crounded to the nearest whole number Compute the reach of two media working together. Subtract step 2 from step 067 - 11) 56 cume reach of two media x 100 o 56 Tingo Computing ating points for womedia Multiply RVXFViX 100 C42 x 5x100) - 126 rating points Multiply RV2XFV2 x 100 25x4x100) 100 rating points Compute total rating points for first two media Add step 4 and step 5 0126100) 226 rating points Computing average frequency for two media Divide totalrating points by cume reach (226/56) = 404 crounded to the nearest Sor full number) - 4 average frequency for two media 100 226 5 6 7 This example demonstrates the process of computing Cume Reach and Frequency in a spot market when more than one national medium is used. In this case, the cumulative effect of two national media in the Cincinnati DMA is a 56% reach and a frequency of 4. Exercise 5C continues this analysis with local media added in April to the extension of the national media. STRATEGIC THINKING ON REACH AND FREQUENCY The question is: "Should a media plan favor reach or frequency? The initial answer is "That Depends.- Many factors will impact this decision. Some are marketing factors. Some are message factors Others are media factors. Here is a checklist of reasons why a media plan could or should favor reach or frequency Reasons to Favor Reach Over Frequency Market Factors Product is in its growth phase The brand is a category leader with high awareness and high market share The product is in a high-involvement" category There is little to moderate competitive advertising The product is purchased once a month or less often A new channel of distribution is coming online, or there is a new location in cur- rent stores where the product will be placed New features or packaging Previous campaigns that favored reach have been successful Product uniqueness and value are easily understood The target audience consists primarily of users rather than influencers Exercise 5C: Modified Sainsbury Method for Estimating Spot Market Reach and Frequency Revisit the instructions for the Modified Sainsbury Method starting on page 151 and compute the Cume Reach and Frequency achieved in Cincinnati when local radio is added to the national media plan in April. Use the worksheet tables and enter your answers in the four blanks immedi- ately below Note: RV1 means Reach for Vehicle #1. FV1 means Frequency for Vehicle #1. Media Plan Facts Media Vehicle #1 National Television #2 National Magazine #3 Cincinnati Radio National R&F (from steps 3 & 7) Cincinnati R&F. (from steps 11 & 14) APRIL Reach Frequency 55 4 29 45 50 3 Computing Cume Reach for Two Media Step 1: Add RV1- RV2 Step 2: Multiply RVI X RV2 Step 3: Compute the reach of two media working together (RVL.2). Subtract step 2 from step 1. Round to the nearest whole number. Remember the "lingo" (x 100). Enter your answer above on the left column blank space'. Computing Rating Points for Two Media Step 4: Multiply RV1 x FV1x 100 Step 5: Multiply RV2 x FV2 x 100 Step 6: Compute total rating points for the first two media. Add step 4 and step 5. Computing Cume Frequency for Two Media Step 7: Divide total rating points by cume reach (rounded to the nearest .5 or full number). Enter your answer above in the right column blank space'. Show Your Work Here Answer Step 1 2 3* 4 5 6 7 174 CHAPTER 5 Computing Cume Reach for Three Media Step 8: Multiply RV3 by the correct Audience Fragmentation Factor Step 9: Compute cume reach for RV1,2 (step 3) + adjusted RV3 Step 10: Multiply cume reach RV1,2 (step 3) x adjusted RV3 Step 11: Compute the cume reach for all three media working together. Subtract step 10 from step 9. Round to the nearest whole number. Remember the "lingo" (x100). Enter your answer on the front of this exercise in the left column blank space Computing Rating Points for Three Media Step 12: Multiply (unadjusted) RV3 x FV3 x 100 Step 13: Compute total rating points for the three media. Add step 6 and step 12 Computing Cume Frequency for Three Media Step 14: Divide total rating points by the three-media cume reach. Step 13/step 11 (rounded to the nearest .5 or full number). Enter your answer on the front of this exercise in the right column blank space Show Your Work Here Step 8 Answer 9 10 12 13 149 THE RIGHT EXPOSURE LEVEL 151 Exhibit 5.6 shows the reach percentage for three different levels of ad exposure frequencies (1,8. and 5) that are produced by various rating point levels The Law of Diminishing Returns As with most things in business. there is a point at which or a path by which more dollars invest- ed will not yield the same return as previous dollars. In advertising exposure, there can be a point beyond which ad dollars are actually producing diminishing returns and are no longer effective This fattening effect is shown in Exhibit 56. The exhibit simply shows the fattening of the reach curve as more rating points are purchased and how the reach level goes down as the frequency of exposure goes up Notice that if an ad runs only one time, the curve flattens more than the 3+ ad exposure and the 5+ ad exposure. This is one of the immutable laws of nature in advertising Exhibit 5.6 Reach (% Adults 18-49) Reach, Frequency, and TRPS 100 90 1+Ad Exposures 80 3. 70 3+Ad 5xposures 60 50 40 5+Ad Exposures 30 20 10 3+ 0 0 250 500 1000 1250 1500 750 Total Rating Points The Modified Sainsbury Method for Estimating Cume Reach and Frequency from National and Local Media National brand media plans often have a national media umbrella component and another com- ponent for important spot markets like the Top 25. When the media plan uses only one national medium, like national television, it is relatively easy to estimate reach and frequency on a nation- al basis Further, it is assumed national media have geographical coverage matching the geographic distribution of the nation's population. The levels of reach and frequency achieved in any city in the country would be the same as the national levels of reach and frequency. In other words, if a national media plan were expected to deliver a reach of 70(%) and a frequency of 5 nationally, then it would be expected the reach and frequency in Cincinnati and San Diego to be the same. When two national media, like television and magazines, are used the estimation of reach and frequency becomes a little more complicated. When a local advertising medium is added to the 152 CHAPTER 5 national media mix it can become very difficult to estimate the cumulative reach and frequency achieved in individual spot markets. The Sainsbury Method is a way to quickly estimate the cumulative effect of national and local media on the reach and frequency achieved in a spot market. Lacking a sophisticated computer program, this method is adequate for purposes of understanding what happens to local reach and frequency levels when local media is added to a national media plan. To fully complete a Sainsbury reach and frequency projection, you should be familiar with the following equations and terminology: Rating Points/Cume Reach - Average Frequency Reach x Frequency = Rating Points RVI = Reach of media vehicle #1 FV1 = Frequency of media vehicle #1 Lingo = The custom in media is to express percentages as whole numbers. Therefore, a 65% reach is expressed as a reach of 65. The Audience Fragmentation Factors, which say every time you add a medium, you will also have diminishing returns and the less efficient each one becomes. Three of the benchmarks used in the industry are provided here: .90 for the 3rd medium only .85 for the 4th medium only .82 for the 5th medium only Example Media Plan Facts: Media Vehicle #1 National Television #2 National Magazine #3 Cincinnati Radio National R&F (From steps 3 & 7) Cincinnati R&F (Nat'l media only) MARCH Reach Frequency 42% 3 25 % 0 56 4 56 4 AIA OAW Sample Cume Reach and Frequency Worksheet Compute the Cume Reach and Frequency achieved in Cincinnati by the two national media used in March. Simply follow the steps in Exhibit 5.7 to get to the answer. 153 THE RIGHT EXPOSURE LEVEL Exhibit 5.7 Answer Step .67 1 .11 56 2 3 126 4 Show-Your-Work Column Computing Cume Reach for two Med Add RV RV2042 25) - 57 Muty RVI RV2 (4225) 11 crounded to the nearest whole number Compute the reach of two media working together. Subtract step 2 from step 067 - 11) 56 cume reach of two media x 100 o 56 Tingo Computing ating points for womedia Multiply RVXFViX 100 C42 x 5x100) - 126 rating points Multiply RV2XFV2 x 100 25x4x100) 100 rating points Compute total rating points for first two media Add step 4 and step 5 0126100) 226 rating points Computing average frequency for two media Divide totalrating points by cume reach (226/56) = 404 crounded to the nearest Sor full number) - 4 average frequency for two media 100 226 5 6 7 This example demonstrates the process of computing Cume Reach and Frequency in a spot market when more than one national medium is used. In this case, the cumulative effect of two national media in the Cincinnati DMA is a 56% reach and a frequency of 4. Exercise 5C continues this analysis with local media added in April to the extension of the national media. STRATEGIC THINKING ON REACH AND FREQUENCY The question is: "Should a media plan favor reach or frequency? The initial answer is "That Depends.- Many factors will impact this decision. Some are marketing factors. Some are message factors Others are media factors. Here is a checklist of reasons why a media plan could or should favor reach or frequency Reasons to Favor Reach Over Frequency Market Factors Product is in its growth phase The brand is a category leader with high awareness and high market share The product is in a high-involvement" category There is little to moderate competitive advertising The product is purchased once a month or less often A new channel of distribution is coming online, or there is a new location in cur- rent stores where the product will be placed New features or packaging Previous campaigns that favored reach have been successful Product uniqueness and value are easily understood The target audience consists primarily of users rather than influencers


