

Question: modify the code to plot the graphs for the attached problem % Givensxmin = e;X = linspace ( xmin , xmax, 2 0 1 )
modify the code to plot the graphs for the attached problem Givensxmin e;X linspacexmin xmax, ; set number of points here Point loads including support reactions negative force is downward directedPointLoads ; ; ; ; domain of application of the distributed loadwxmax ; This returns an array if x is an arraywLoad @xxwxmin & x figureName'Sample Problem ;
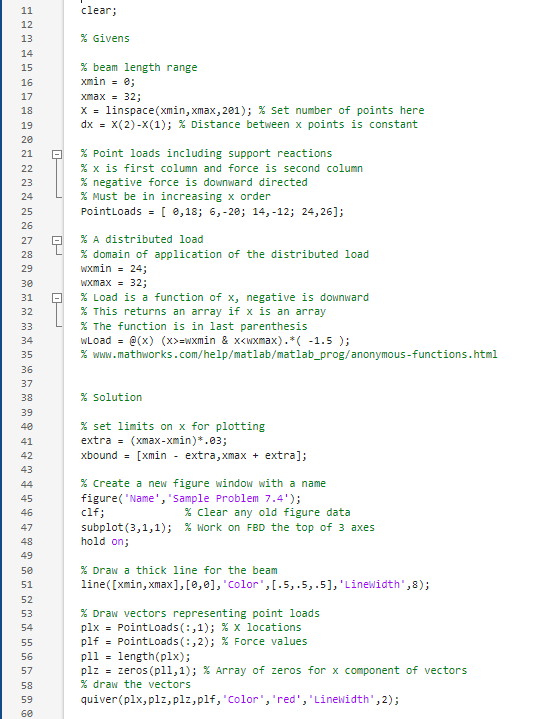
clf; Clear any old figure data
subplot; work on FBD the top of axes
hold on;
Draw a thick line for the beam
linexminxmax'Color','LineWidth ;
Draw vectors representing point loads
plx PointLoads:; x locations
plf PointLoads:; Force values
pll lengthplx;
plz zerospll; Array of zeros for x component of vectors
draw the vectors
quiverplxplzplzplf'Color', 'red','LineWidth', ;xlimxbound; set x bonds to match on all subplots
hold off;
Work on the middle shear plot
subplot ; hold on;
Draw a line at
linexmin xmax 'Color', 'LineWidth ;
shear zeros length define the shear array i ; index into the X array
for xx Xif i ifwptsiwLoadXiwLoadXidx;endif ip lengthplx && xx PointLoadsip ipip; Shift to the next Point Loadii; Shift to the next shear index
end
plotX shear
areaXshear, "FaceColor', ; Draw the shear plot
Add Titles, Labels Etc. Here
xlimxbound; Set plot domain to be the same as other plots
hold off;
Work on the bending moment plot at the bottom
subplot;hold on;
Draw a baseline at y
linexminxmax 'Color', 'LineWidth ;
bending zeroslengthX; Bending Moment Array
Trapezoidal Integration of Shear
i;
for xx X bendingi bendingi end absolute values of the shear and bending moment.
Fig.
Step by Step Solution
There are 3 Steps involved in it
1 Expert Approved Answer
Step: 1 Unlock

Question Has Been Solved by an Expert!
Get step-by-step solutions from verified subject matter experts
Step: 2 Unlock
Step: 3 Unlock