

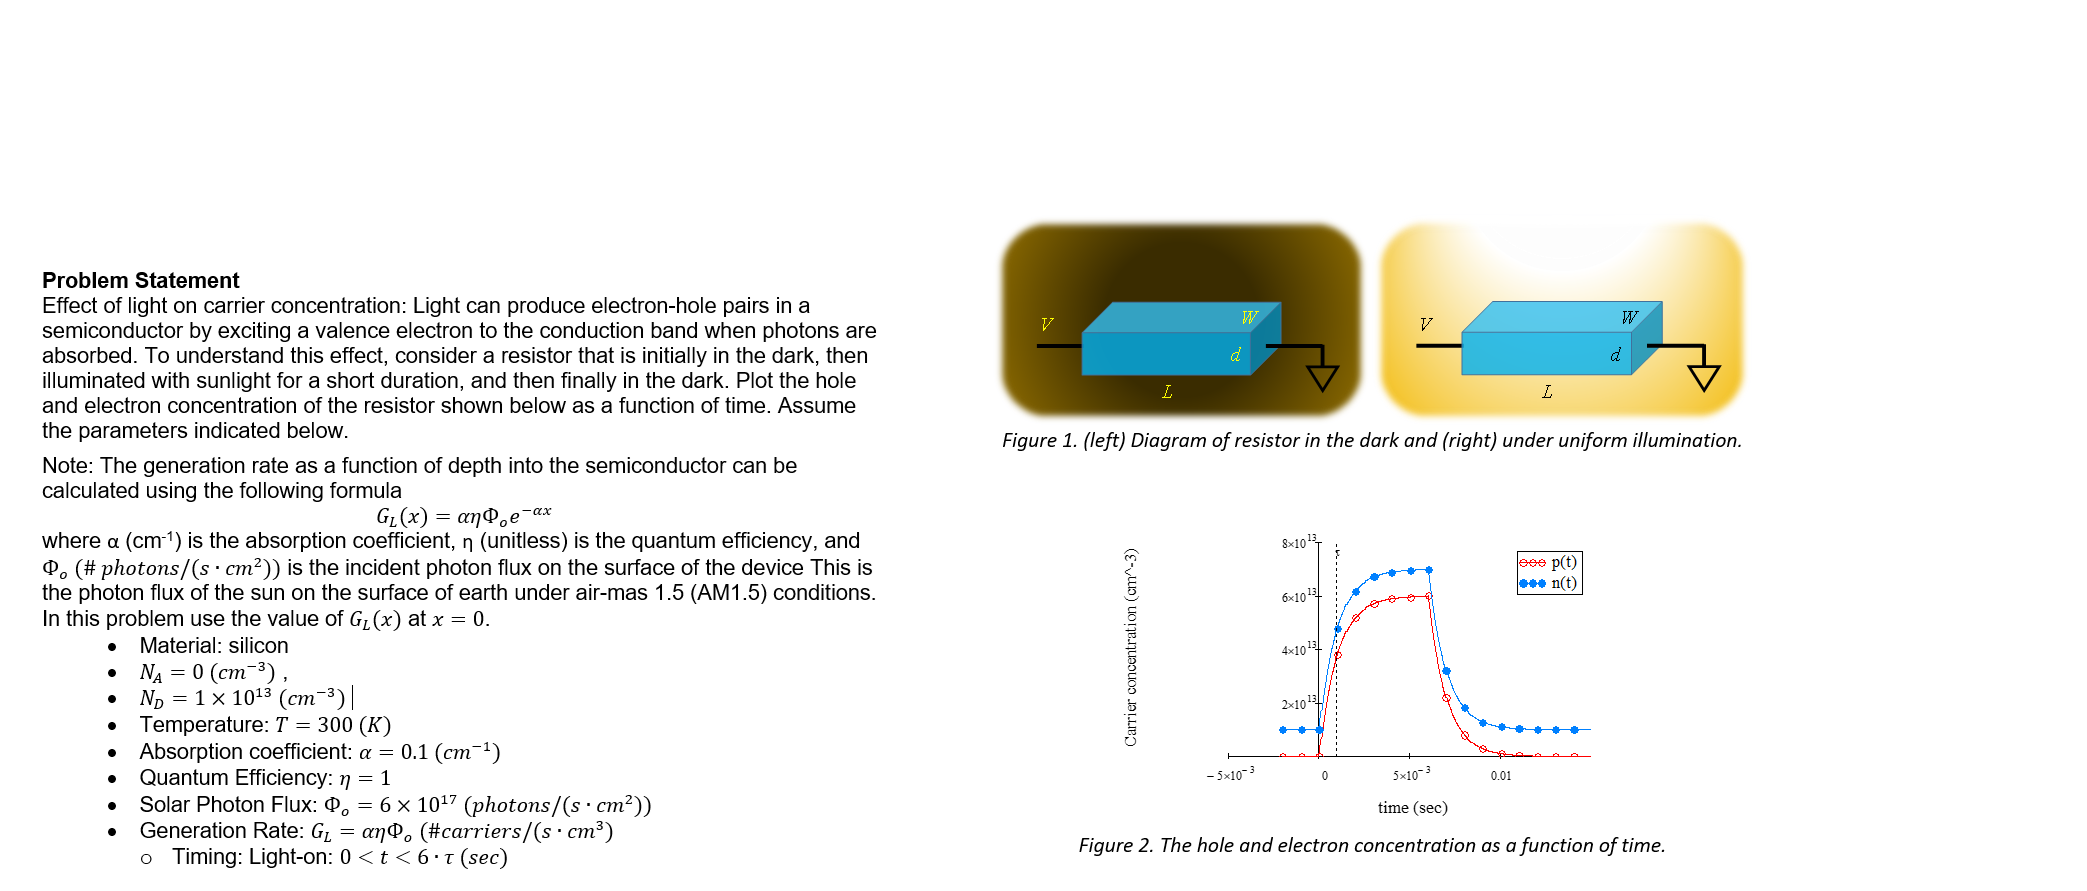
Question: modify this matlab code it should look like figure 2 please % Sample MATLAB code for plotting Figure 2 % Define time vector ( in
modify this matlab code it should look like figure please Sample MATLAB code for plotting Figure
Define time vector in seconds
time linspace;
Define carrier concentration for electrons nt and holes ptin cm
These are sample data points and need to be adjusted to match the figure exactly
nt eones linspaceeeeones linspaceeeeones;
pt eones linspaceeeeones linspaceeeeones;
Plotting
figure;
hold on;
plottime ptro 'MarkerSize', 'LineWidth', ; Holes pt in red
plottime ntbo 'MarkerSize', 'LineWidth', ; Electrons nt in blue
hold off;
Adding labels and title
xlabeltime sec 'FontSize', ;
ylabelCarrier concentration cm 'FontSize', ;
titleThe hole and electron concentration as a function of time', 'FontSize', ;
Adding legend
legendptnt 'FontSize', 'Location', 'northeast';
Formatting the axes
setgca 'FontSize', ;
grid on;
Set axis limits to match the figure
xlim;
ylime;
Display the figure
setgcf 'Color', w;
Step by Step Solution
There are 3 Steps involved in it
1 Expert Approved Answer
Step: 1 Unlock

Question Has Been Solved by an Expert!
Get step-by-step solutions from verified subject matter experts
Step: 2 Unlock
Step: 3 Unlock