

Question: Module 13 Assignment Chi-square ing Heading 1 Heading 2 Title Subtitle Subtle Emph Emphasis Intense Emp... Strong Quote Intense Quote GHModule 13 Assignment Chi-square 1.
Module 13 Assignment Chi-square
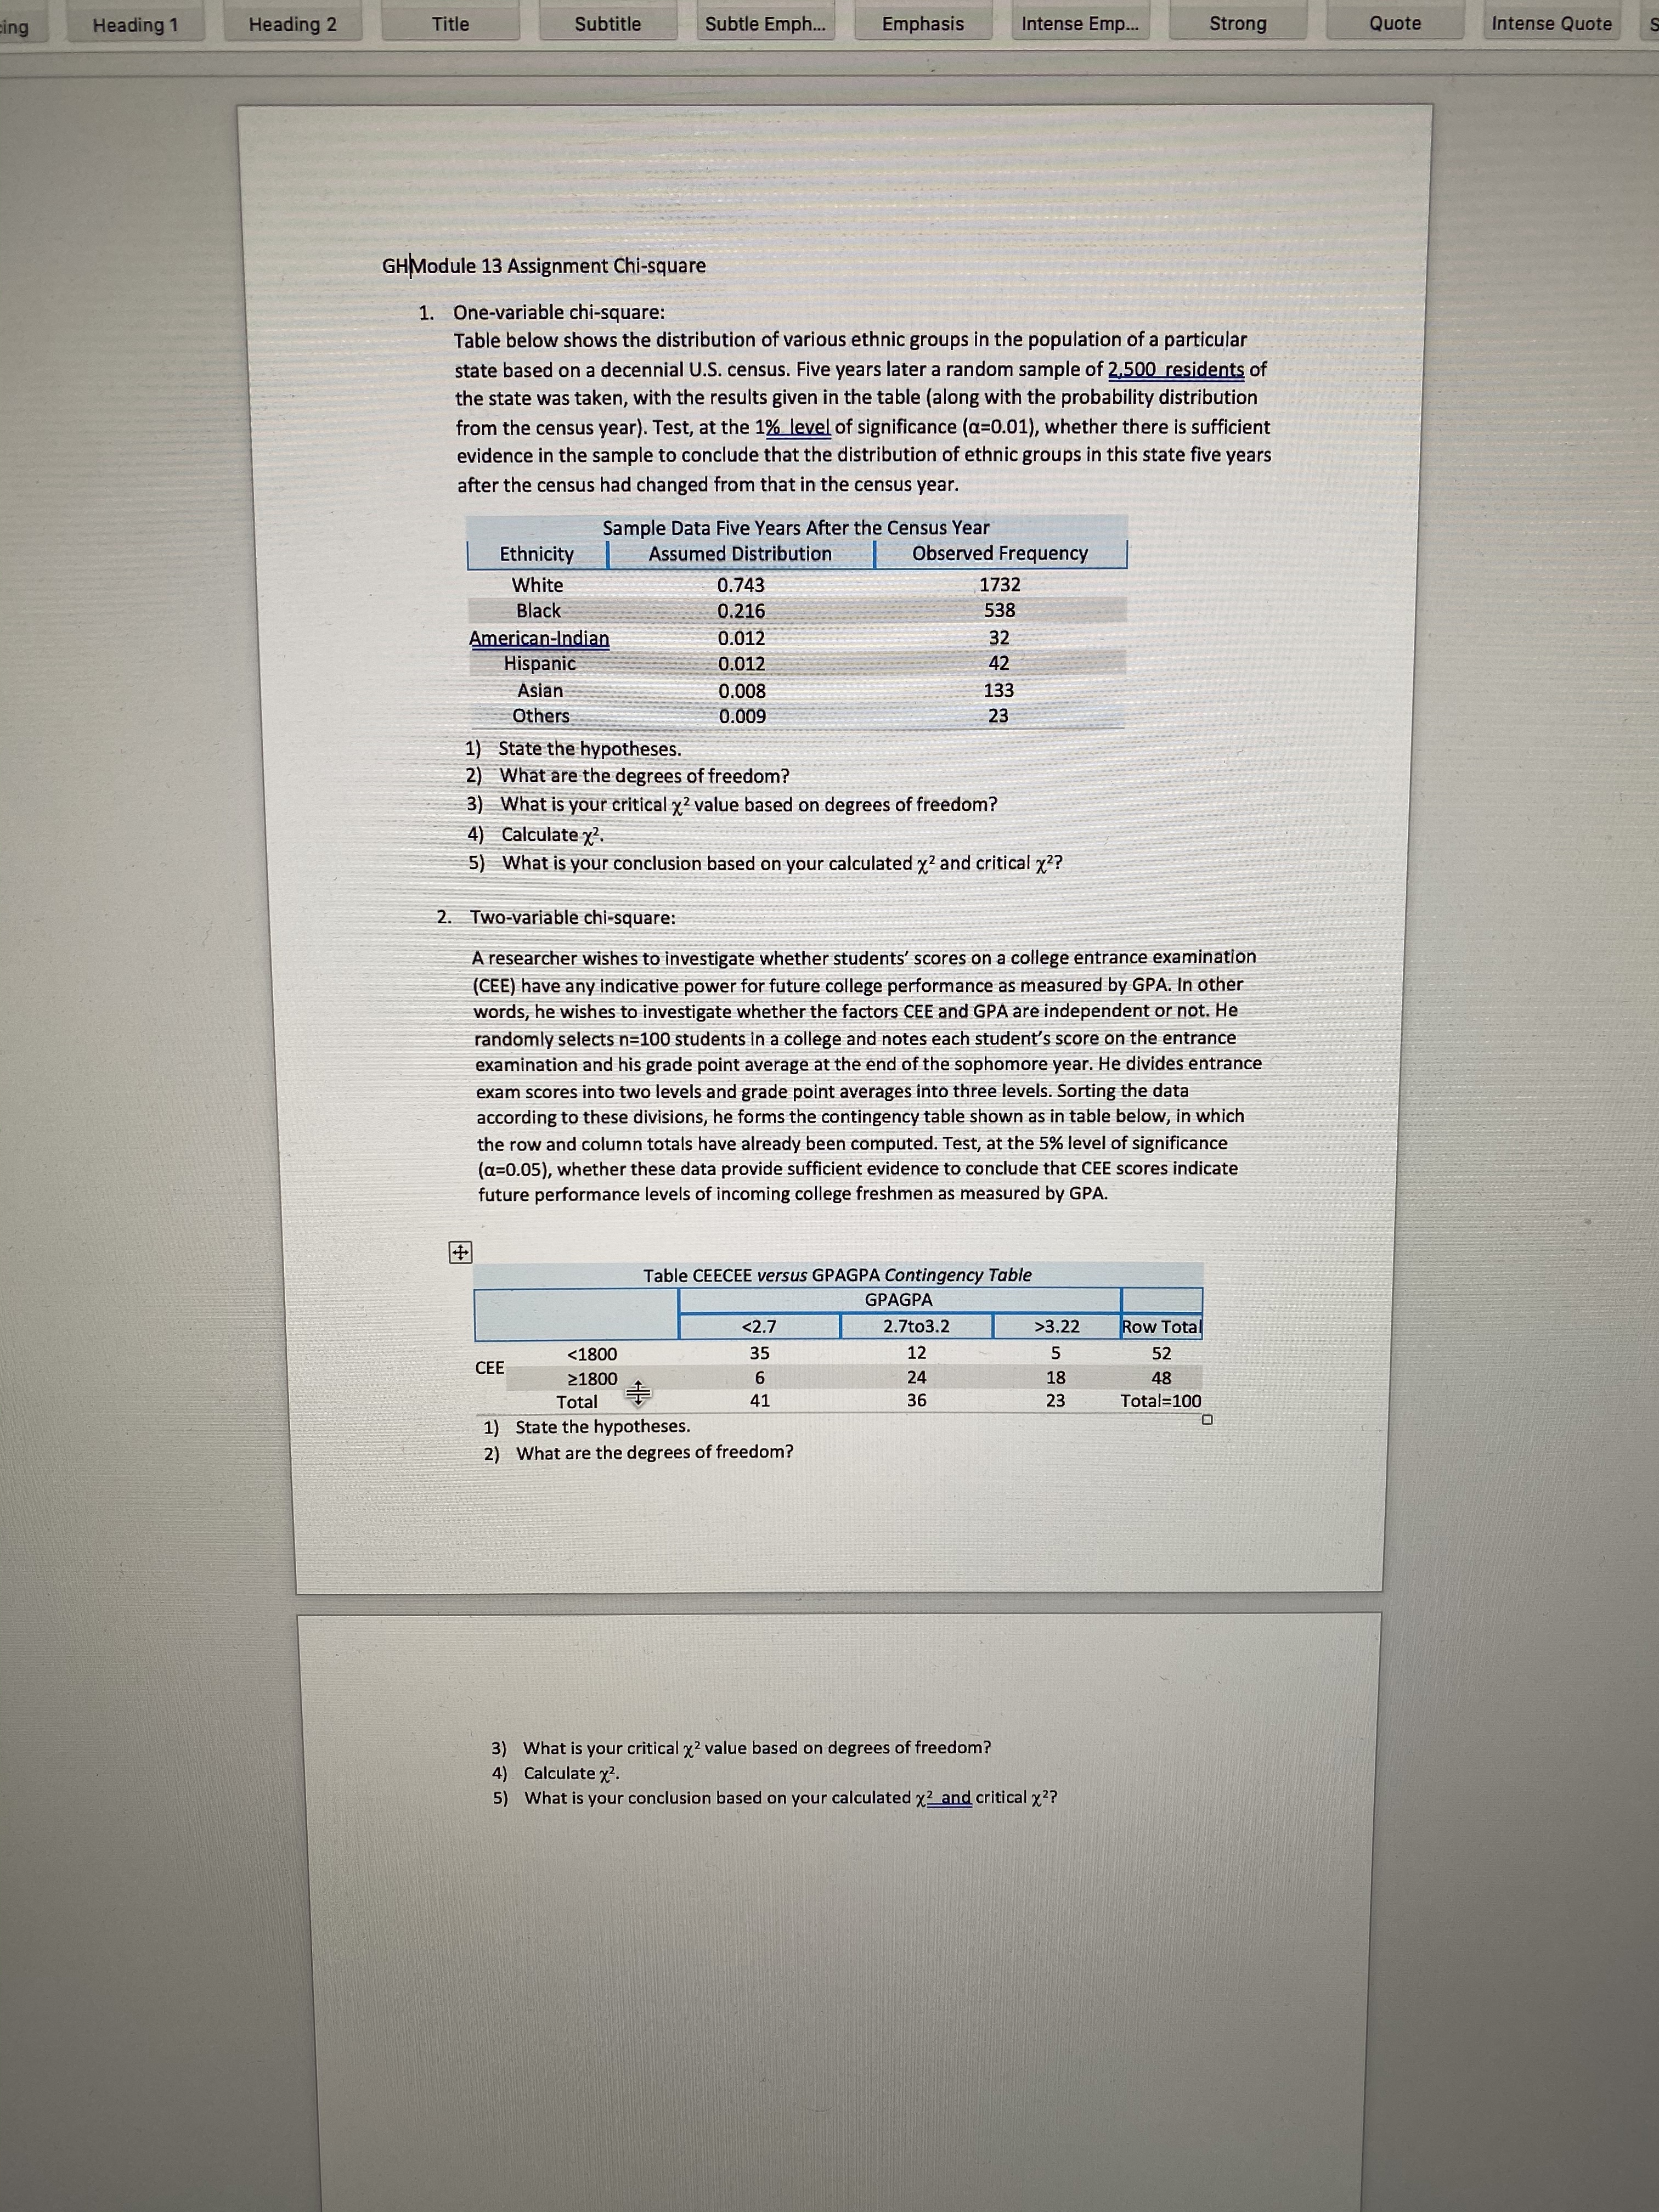
ing Heading 1 Heading 2 Title Subtitle Subtle Emph Emphasis Intense Emp... Strong Quote Intense Quote GHModule 13 Assignment Chi-square 1. One-variable chi-square: Table below shows the distribution of various ethnic groups in the population of a particular state based on a decennial U.S. census. Five years later a random sample of 2.500 residents of the state was taken, with the results given in the table (along with the probability distribution from the census year). Test, at the 1% level of significance (a=0.01), whether there is sufficient evidence in the sample to conclude that the distribution of ethnic groups in this state five years after the census had changed from that in the census year. Sample Data Five Years After the Census Year Ethnicity Assumed Distribution Observed Frequency White 0.743 1732 Black 0.216 538 American-Indian Hispanic 0.012 32 0.012 42 Asian 0.008 133 Others 0.009 23 1) State the hypotheses. 2) What are the degrees of freedom? 3) What is your critical x2 value based on degrees of freedom? 4) Calculate x2 ) What is your conclusion based on your calculated x2 and critical x2? 2. Two-variable chi-square: A researcher wishes to investigate whether students' scores on a college entrance examination (CEE) have any indicative power for future college performance as measured by GPA. In other words, he wishes to investigate whether the factors CEE and GPA are independent or not. He randomly selects n=100 students in a college and notes each student's score on the entrance examination and his grade point average at the end of the sophomore year. He divides entrance exam scores into two levels and grade point averages into three levels. Sorting the data according to these divisions, he forms the contingency table shown as in table below, in which the row and column totals have already been computed. Test, at the 5% level of significance (a=0.05), whether these data provide sufficient evidence to conclude that CEE scores indicate future performance levels of incoming college freshmen as measured by GPA. Table CEECEE versus GPAGPA Contingency Table GPAGPA 42.7 2.7to3.2 >3.22 Row Total CEE 1800 35 12 5 52 21800 24 48 36 18 Total 23 Total=100 1) State the hypotheses. 2) What are the degrees of freedom? 3) What is your critical x2 value based on degrees of freedom? 4) Calculate x2. 5) What is your conclusion based on your calculated x2 and critical x
Step by Step Solution
There are 3 Steps involved in it

Get step-by-step solutions from verified subject matter experts