

Question: MODULE 2: EXPLORING DATA WITH TABLES AND GRAPHS 2-4: Scatterplots, correlation, and regression PART A: e The following are examples of the types of relationships
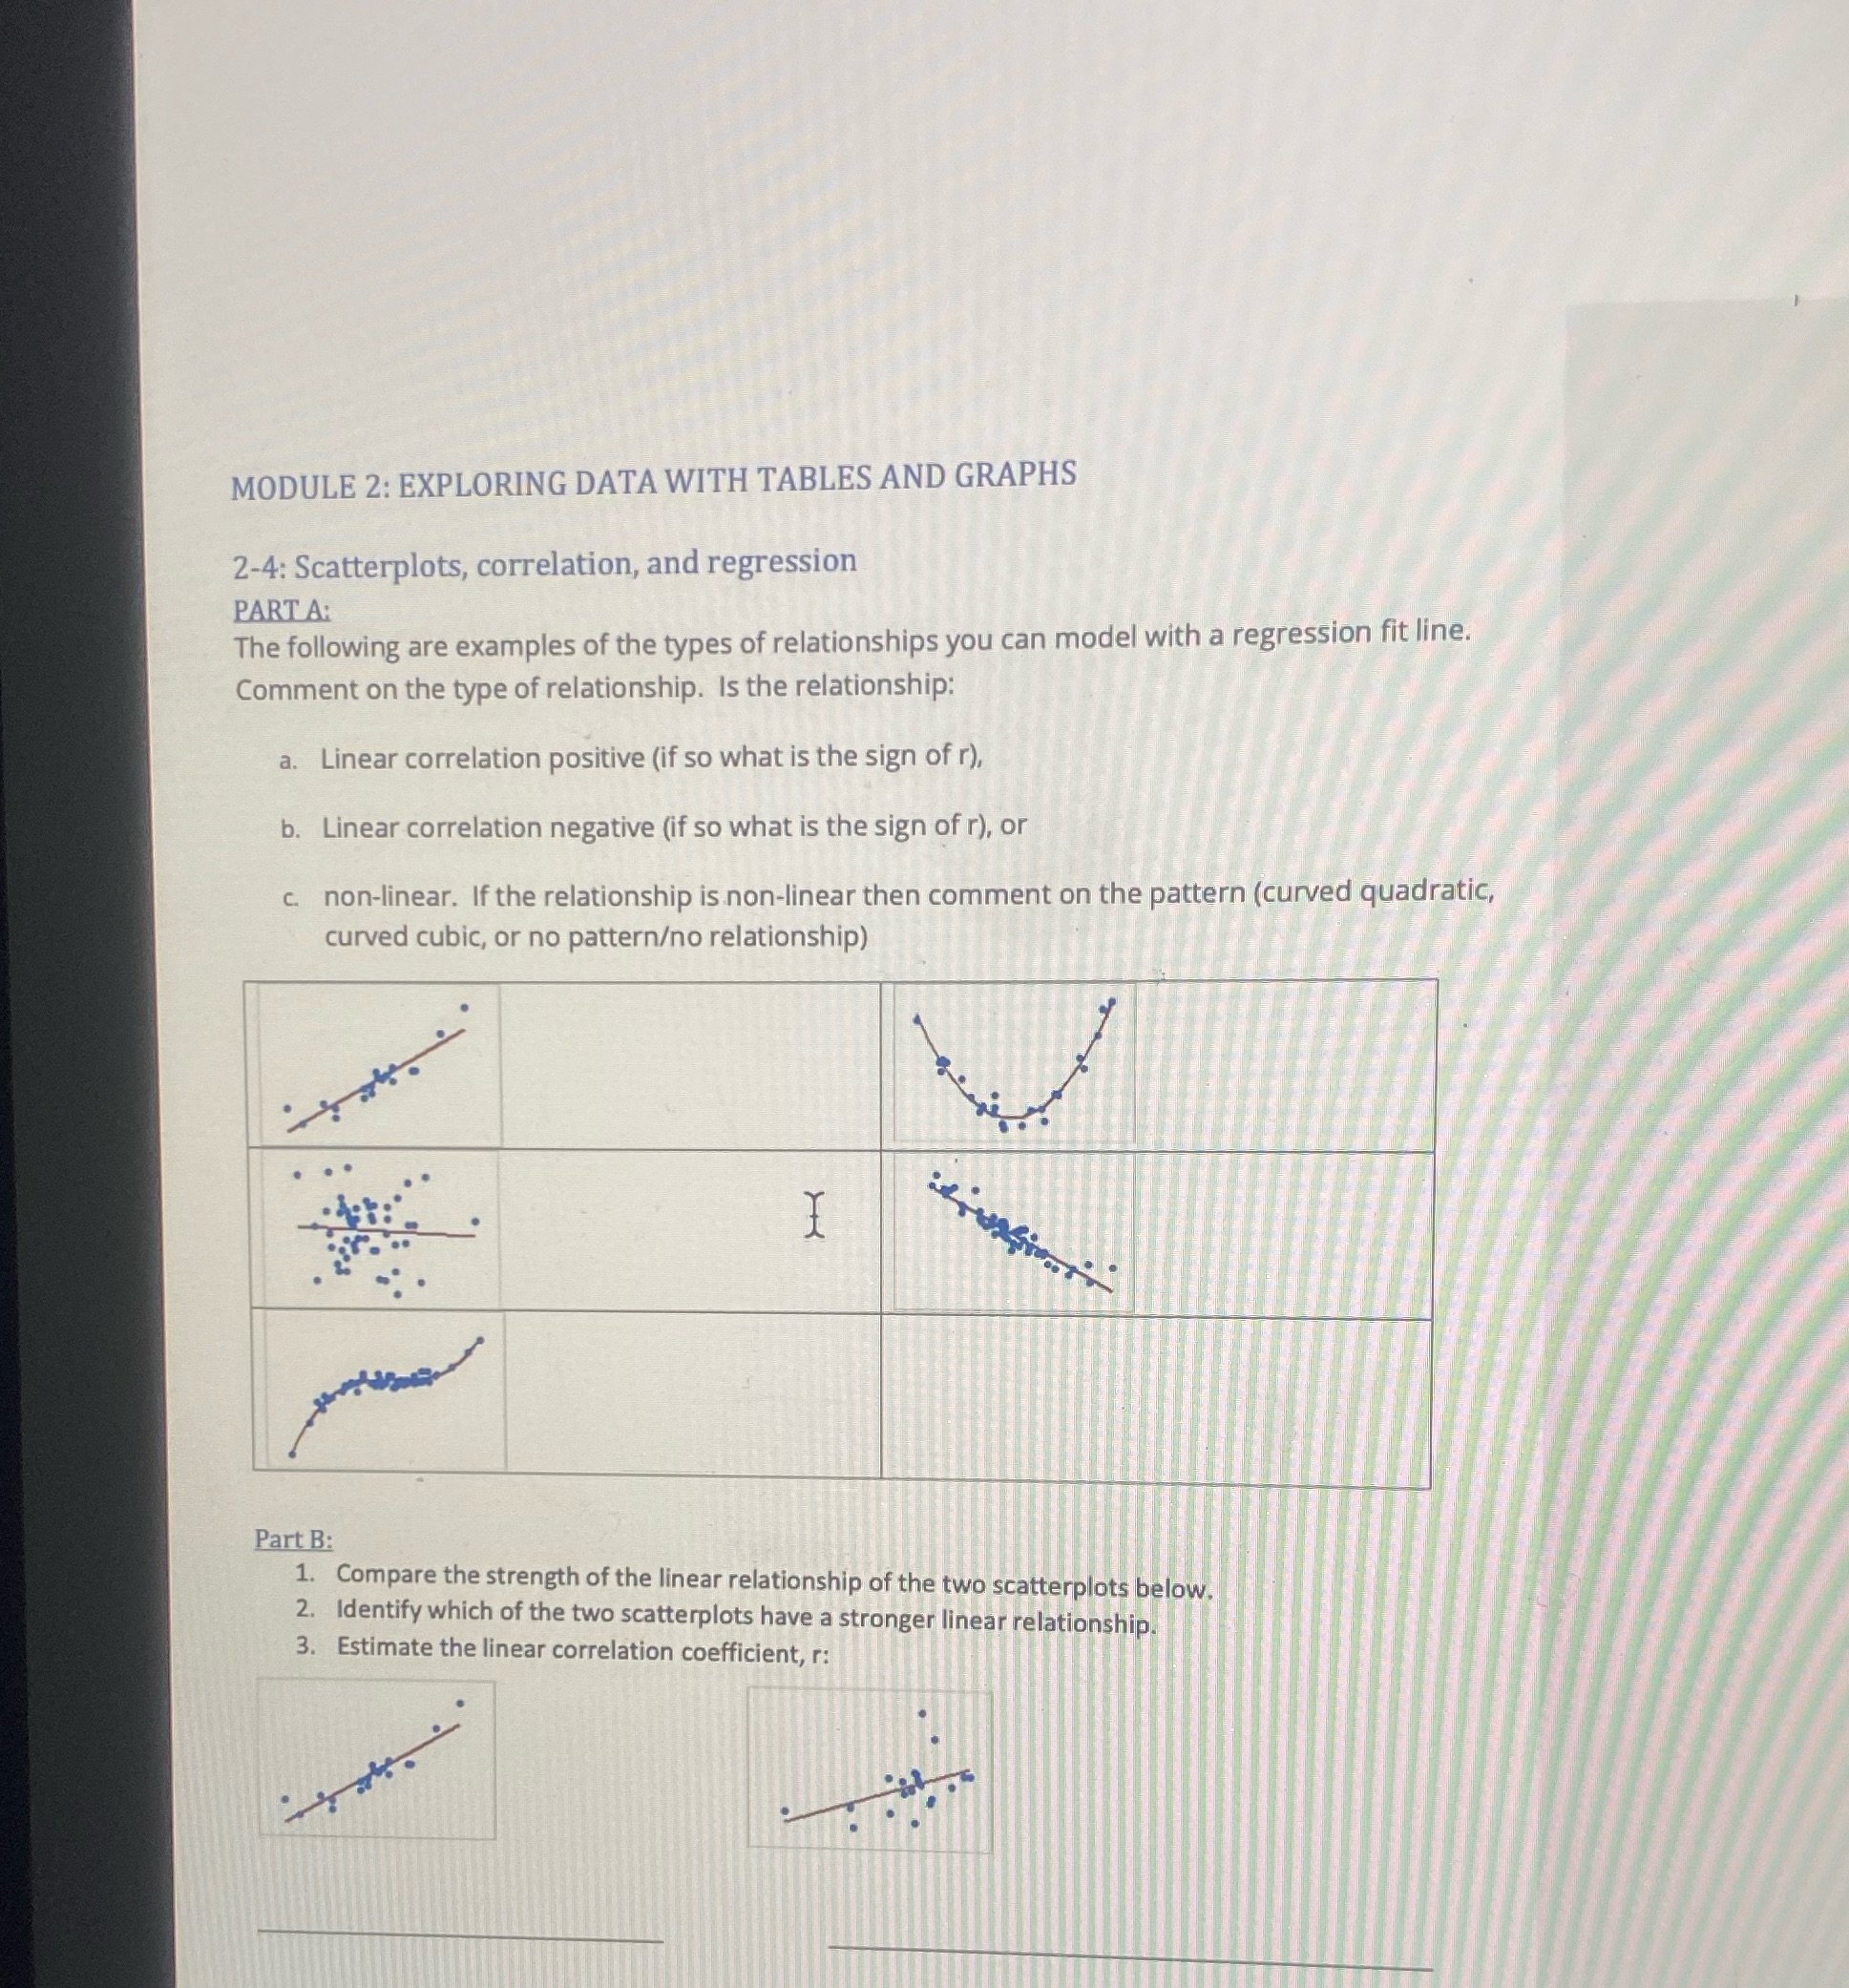
MODULE 2: EXPLORING DATA WITH TABLES AND GRAPHS 2-4: Scatterplots, correlation, and regression PART A: e The following are examples of the types of relationships you can model with a regression fit line. Comment on the type of relationship. Is the relationship: a. Linear correlation positive (if so what is the sign of r), b. Linear correlation negative (if so what is the sign ofr), or non-linear. If the relationship is non-linear then comment on the pattern (cunved quadratic, curved cubic, or no patterno relationship) A% 1 = Part B: 1. Compare the strength of the linear relationship of the two scatterplots below 2. Identify which of the two scatterplots have a stronger linear relationship. 3. Estimate the linear correlation coefficient, r; o
Step by Step Solution
There are 3 Steps involved in it

Get step-by-step solutions from verified subject matter experts