

Question: Module 2 Project 2: Create a Cause-Effect Diagram for this problem: In the first half of the year, a medium size bakery store with both
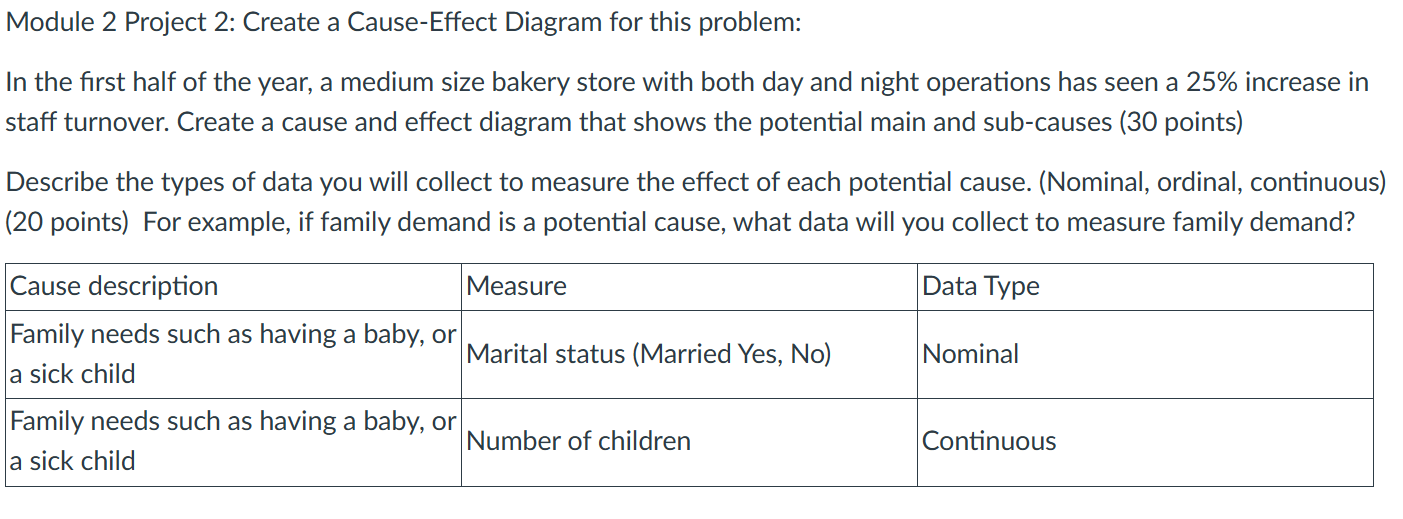
Module 2 Project 2: Create a Cause-Effect Diagram for this problem: In the first half of the year, a medium size bakery store with both day and night operations has seen a 25% increase in staff turnover. Create a cause and effect diagram that shows the potential main and sub-causes (30 points) Describe the types of data you will collect to measure the effect of each potential cause. (Nominal, ordinal, continuous) (20 points) For example, if family demand is a potential cause, what data will you collect to measure family demand
Step by Step Solution
There are 3 Steps involved in it
1 Expert Approved Answer
Step: 1 Unlock

Question Has Been Solved by an Expert!
Get step-by-step solutions from verified subject matter experts
Step: 2 Unlock
Step: 3 Unlock