

Question: Module 2.2 Unit 5 Assignment 1 Cross Tabs [Total marks =25] When do we categorize data? [2] Which data is commonly used for cross-tabs? [3]
![Module 2.2 Unit 5 Assignment 1Cross Tabs[Total marks =25]When do we](https://s3.amazonaws.com/si.experts.images/answers/2024/06/66748bfb180fe_04266748bfae1ea1.jpg)
![categorize data? [2]Which data is commonly used for cross-tabs? [3]How can you](https://s3.amazonaws.com/si.experts.images/answers/2024/06/66748bfba33cb_04366748bfb662c3.jpg)
Module 2.2 Unit 5 Assignment 1
Cross Tabs
[Total marks =25]
- When do we categorize data? [2]
- Which data is commonly used for cross-tabs? [3]
- How can you use calculate RR or OR in EPINFO with data from cross tabs?
Using EPINFO
Go to Epi info at CDChttps://www.cdc.gov/epiinfo/index.html
DOWNLOAD appropriate for you
Look for statcalc
Open EPINFO
Statcalc
ed * black Crosstabulation | |||||
|---|---|---|---|---|---|
black | Total | ||||
0 | 1 | ||||
ed | 0 | Count | 4602 | 1140 | 5742 |
% within ed | 80.1% | 19.9% | 100.0% | ||
1 | Count | 3373 | 675 | 4048 | |
% within ed | 83.3% | 16.7% | 100.0% | ||
2 | Count | 3629 | 327 | 3956 | |
% within ed | 91.7% | 8.3% | 100.0% | ||
3 | Count | 2144 | 493 | 2637 | |
% within ed | 81.3% | 18.7% | 100.0% | ||
Total | Count | 13748 | 2635 | 16383 | |
% within ed | 83.9% | 16.1% | 100.0% |
What are the odds ratios being black for ed 0, 1 and 3 using 2 as the reference group? [15]
Interpret your findings
Calculate ORs for these data below [5]
Alcohol | Liver cancer | Controls |
Yes | 30 | 18 |
No | 70 | 82 |
Total | 100 | 100 |
What is the odds ratio of alcohol drinking to liver cancer?
Interpret your findings
Module 2.2 Unit 5 Assignment 2
Chi-square test
Total grades = 30 marks
- Using the table provided below: [15 marks]
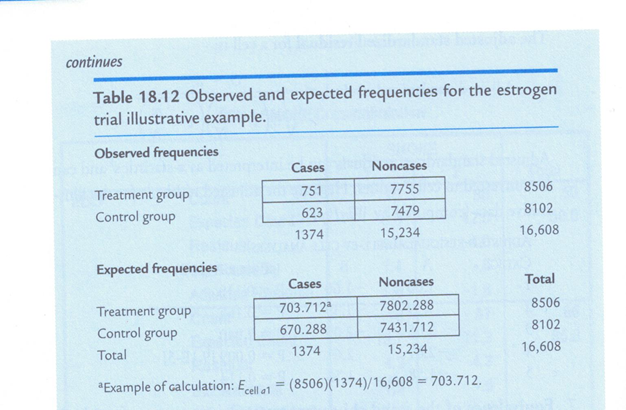
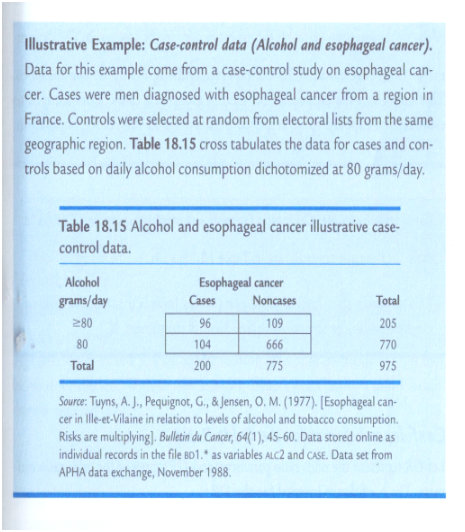
continues Table 18.12 Observed and expected frequencies for the estrogen trial illustrative example. Observed frequencies Cases Noncases Treatment group 751 7755 8506 Control group 623 7479 8102 1374 15,234 16,608 Expected frequencies Cases Noncases Total Treatment group 703.712 7802.288 8506 Control group 670.288 7431.712 8102 Total 1374 15,234 16,608 Example of calculation: Ecee = (8506)(1374)/16,608 = 703.712.Illustrative Example: Case-control data (Alcohol and esophageal cancer). Data for this example come from a case-control study on esophageal can- cer. Cases were men diagnosed with esophageal cancer from a region in France. Controls were selected at random from electoral lists from the same geographic region. Table 18.15 cross tabulates the data for cases and con- trols based on daily alcohol consumption dichotomized at 80 grams/day. Table 18.15 Alcohol and esophageal cancer illustrative case- control data. Alcohol Esophageal cancer grams/day Cases Noncases Total 280 96 109 205 80 104 666 770 Total 200 775 975 Source: Tuyns, A. J., Pequignot, G., & Jensen, O. M. (1977). [Esophageal can- cer in Ille-et-Vilaine in relation to levels of alcohol and tobacco consumption. Risks are multiplying]. Bulletin du Cancer, 64(1), 45-60. Data stored online as individual records in the file BD1. * as variables ALC2 and CASE. Data set from APHA data exchange, November 1988
Step by Step Solution
There are 3 Steps involved in it

Get step-by-step solutions from verified subject matter experts