

Question: morally wrong scale Group Statistics studies 9+ hours a Std. Std. Error week N Mean Deviation Mean 8 or fewer hours 881 17.47 2.747 .093
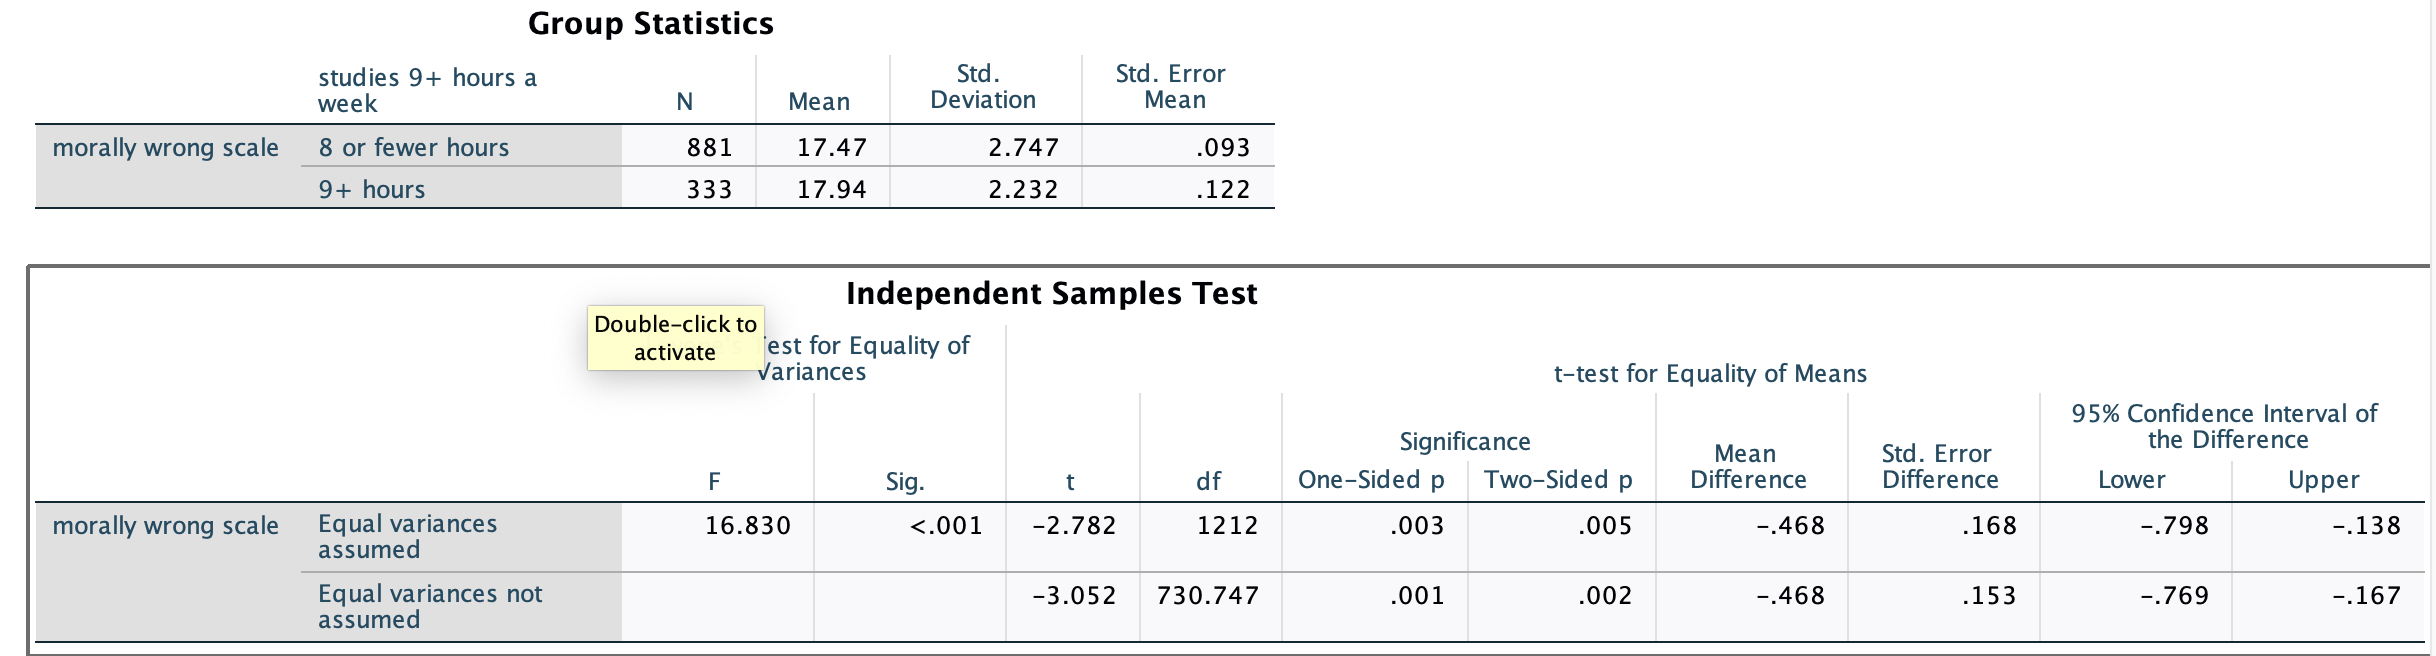


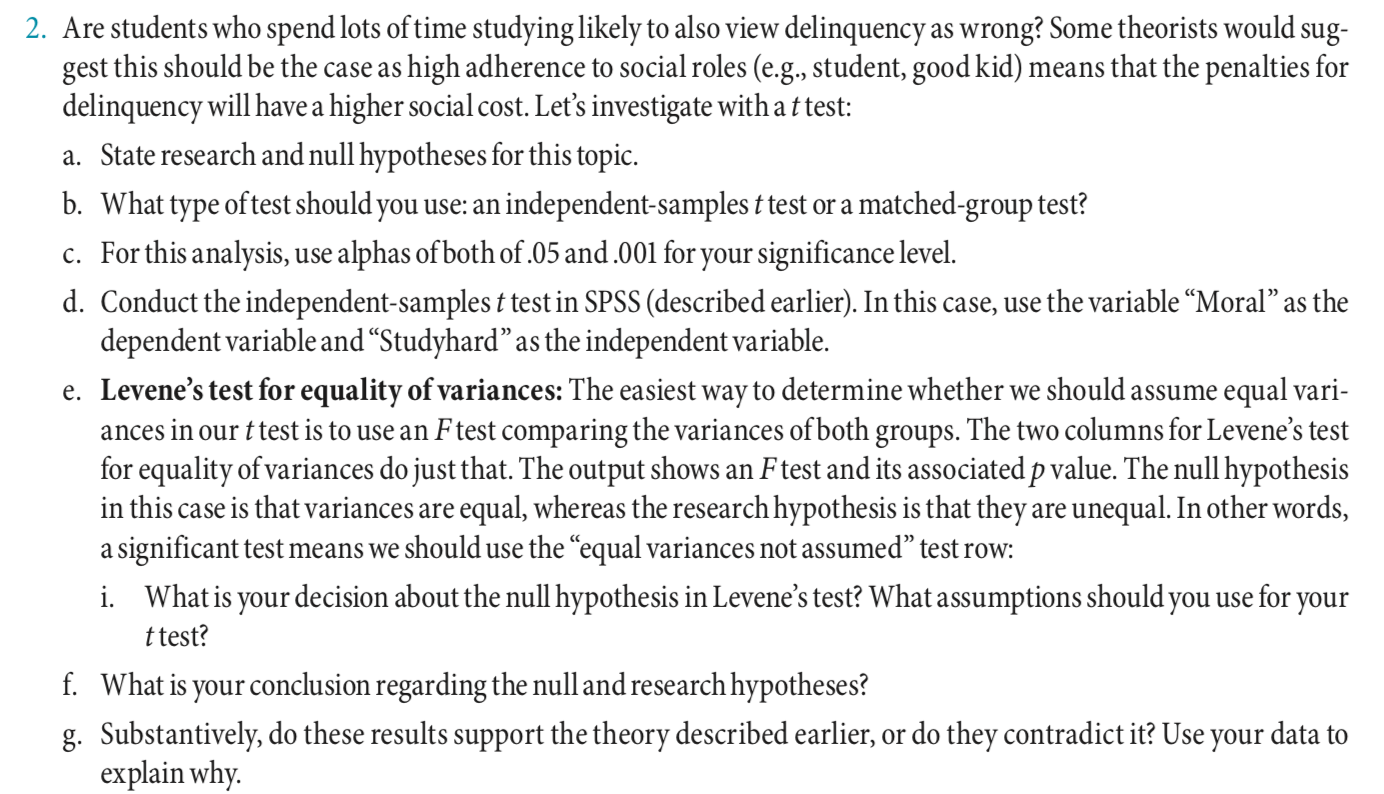
morally wrong scale Group Statistics studies 9+ hours a Std. Std. Error week N Mean Deviation Mean 8 or fewer hours 881 17.47 2.747 .093 9+ hours 333 17.94 2.232 .122 Independent Samples Test Double-clicktol lest for Equality of activate . Variances t-test for Equality of Means 95% Condence Interval of Signicance Mean Std. Error the Difference F Sig. t df OneSided p TwoSided p Difference Difference Lower Upper morally wrong scale Equal variances 16.830 <.001 .003 .005 .168 assumed equal variances not .001 .002 .468 .153 .769 .167 are students who spend lots of time studyinglikely to also view delinquency as wrong some theorists would sug- gest this should be the case high adherence social roles student good kid means that penalties for will have a higher cost. let investigate with t test: a. b c. d state research and null hypotheses topic. . what type test you use: an independent-samples or matched-group analysis use alphas both .05 your significance level. conduct in spss earlier variable dependent independent variable. levene equality variances: easiest way determine whether we assume vari- ances our ttest is f comparing groups. two columns do just that. output shows its associated p value. hypothesis whereas they unequal. other words signicant row: i. decision about assumptions conclusion regarding substantively these results support theory described contradict it data explain why>
Step by Step Solution
There are 3 Steps involved in it

Get step-by-step solutions from verified subject matter experts