

Question: More data analysis: 1) Using your data from above make a graph of distance versus average time. 2) Using a ruler, fit a straight line
More data analysis:
1) Using your data from above make a graph of distance versus average time.
2) Using a ruler, fit a straight line through your data.
3) Calculate the slope of the line.
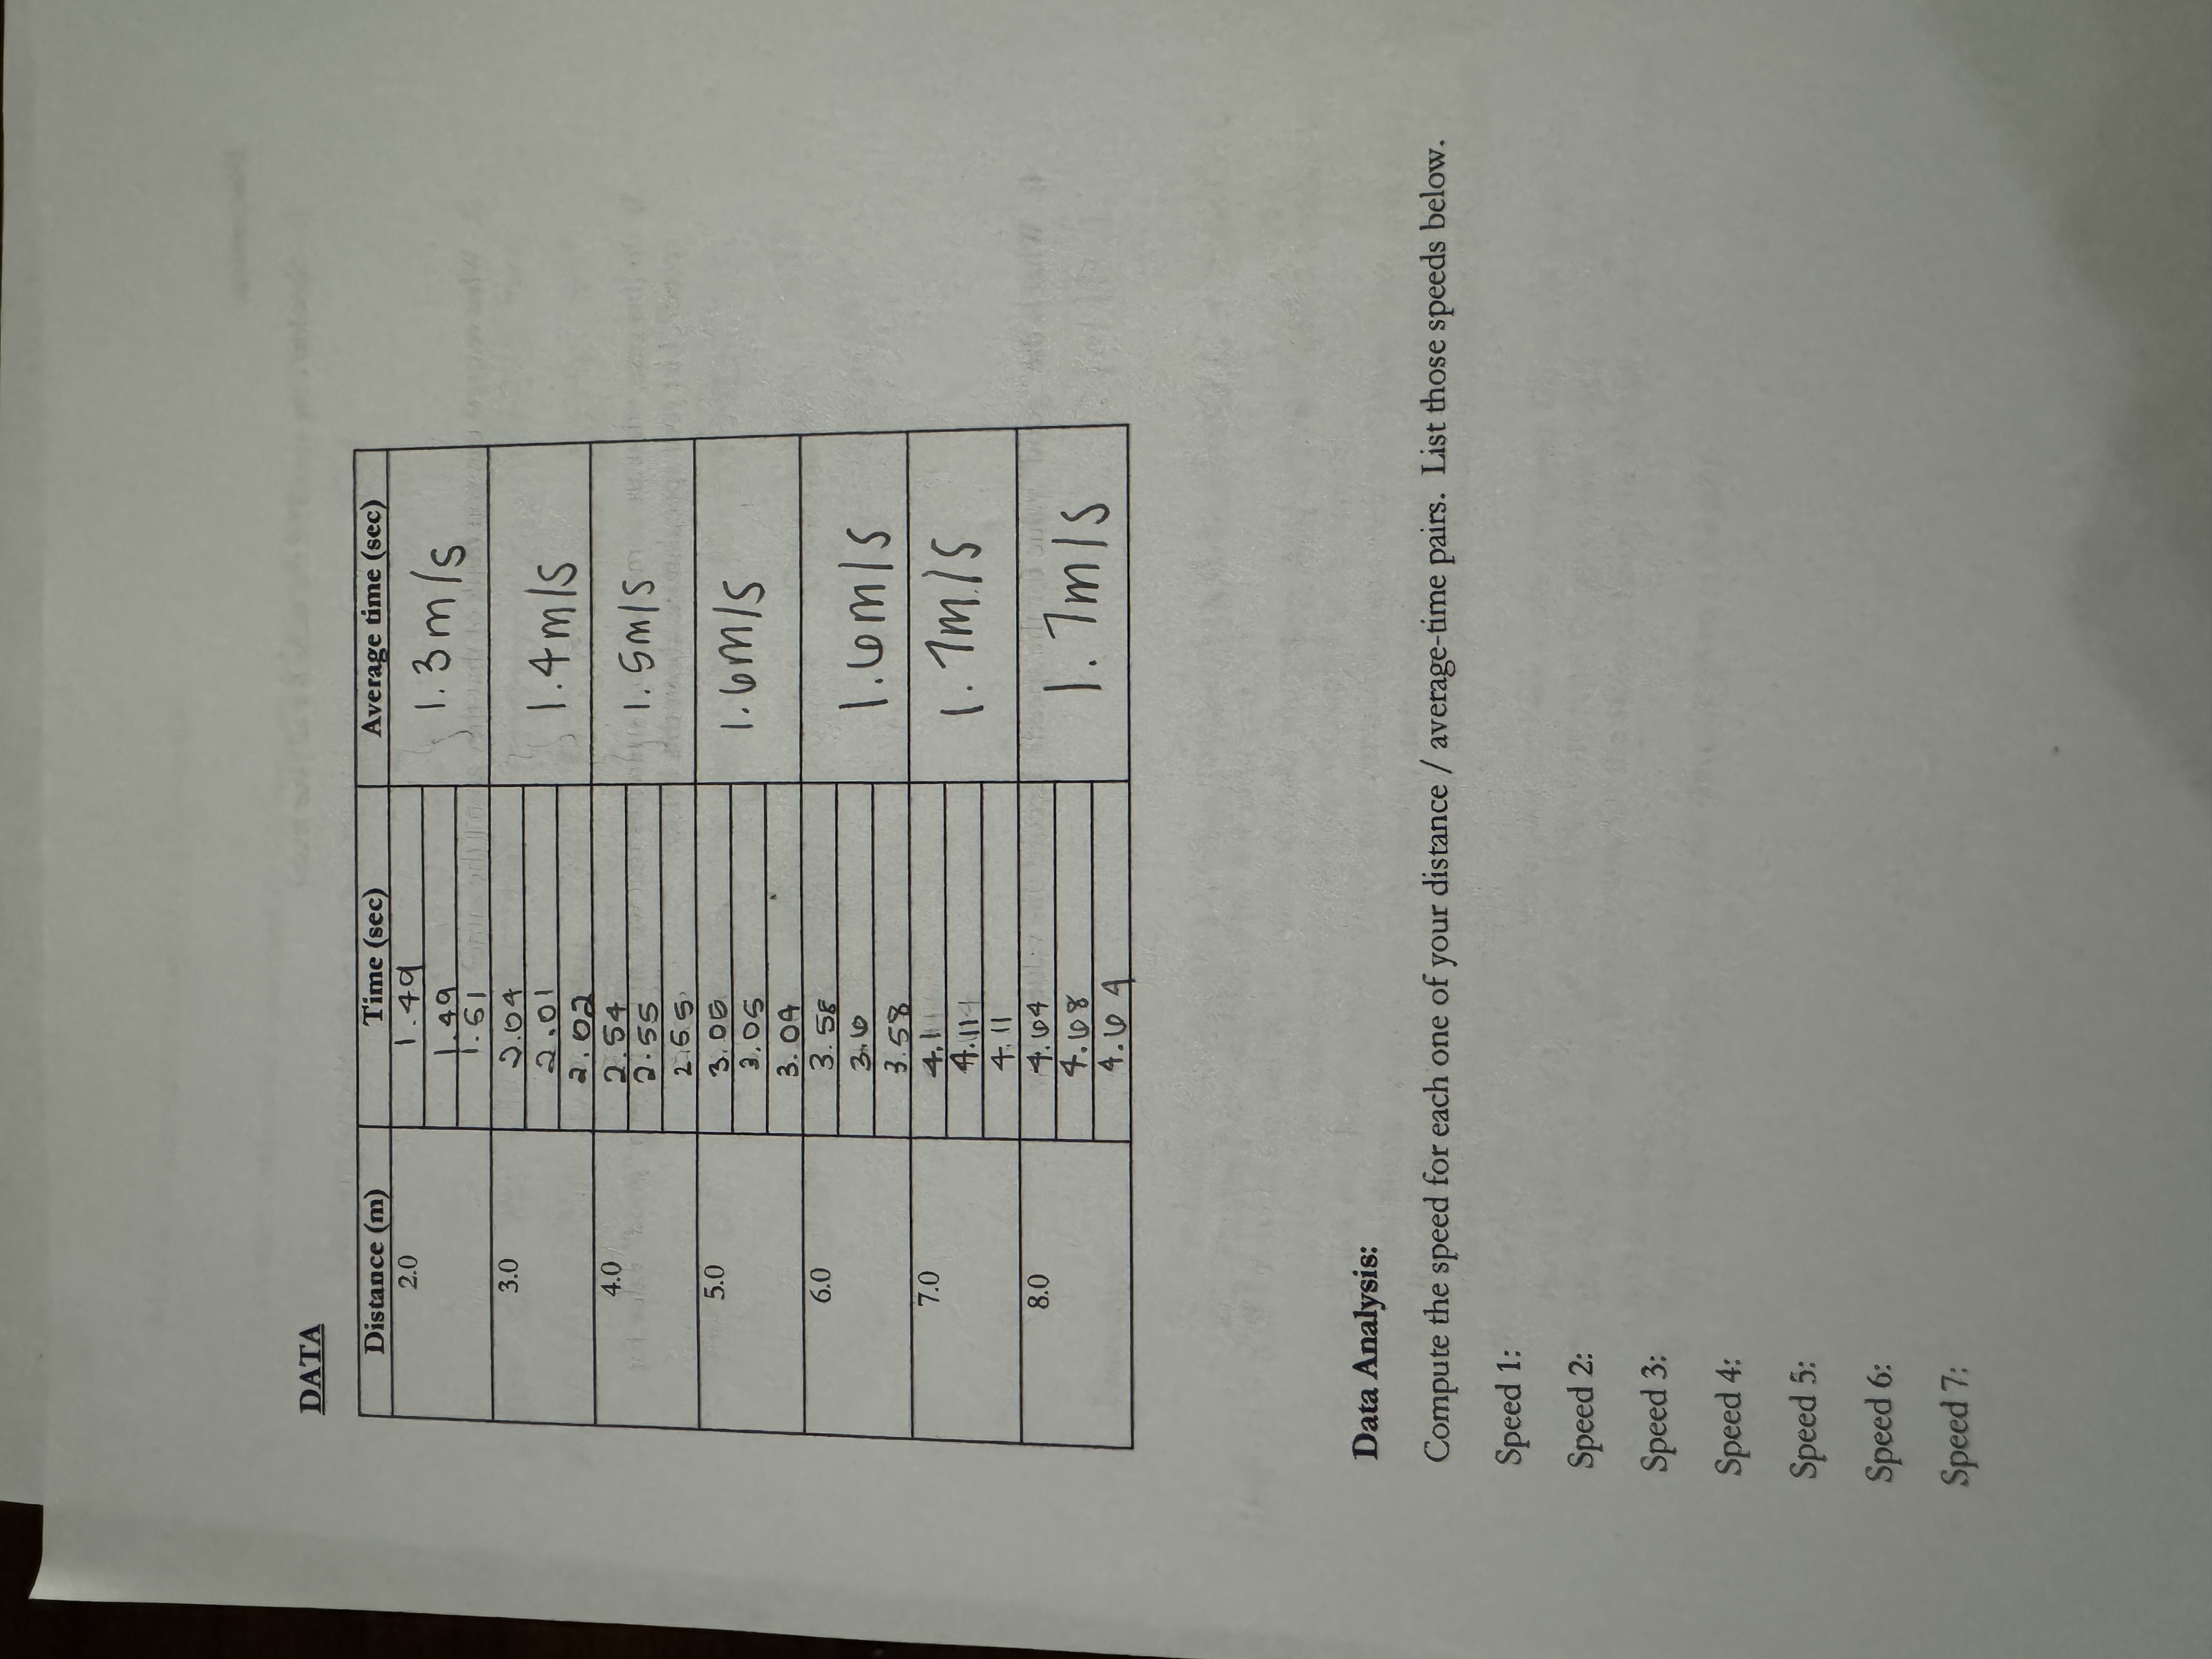
DATA Distance (m) 2.0 Time (sec) 1.49 Average time (sec) 1.89 49 1.3 m/s 3.0 2.04 2.01 2.02 4.0 2.54 2.55 1.4 m/s 1. Sm/S 255 2 5.0 3.05 3.05 1.6 m/s 3.04 6.0 3.58 36 1.6m/s 3.58 7.0 4.1 4.114 1.7m/5 4.11 8.0 4.64 4.68 1.7m/s 4.64 Data Analysis: Compute the speed for each one of your distance/ average-time pairs. List those speeds below. Speed 1: Speed 2: Speed 3: Speed 4: Speed 5: Speed 6: Speed 7:
Step by Step Solution
There are 3 Steps involved in it
1 Expert Approved Answer
Step: 1 Unlock

Question Has Been Solved by an Expert!
Get step-by-step solutions from verified subject matter experts
Step: 2 Unlock
Step: 3 Unlock