

Question: Moving to another question will save this response. Question 8 When you want to compare groups on certain characteristics, at least one variable must be


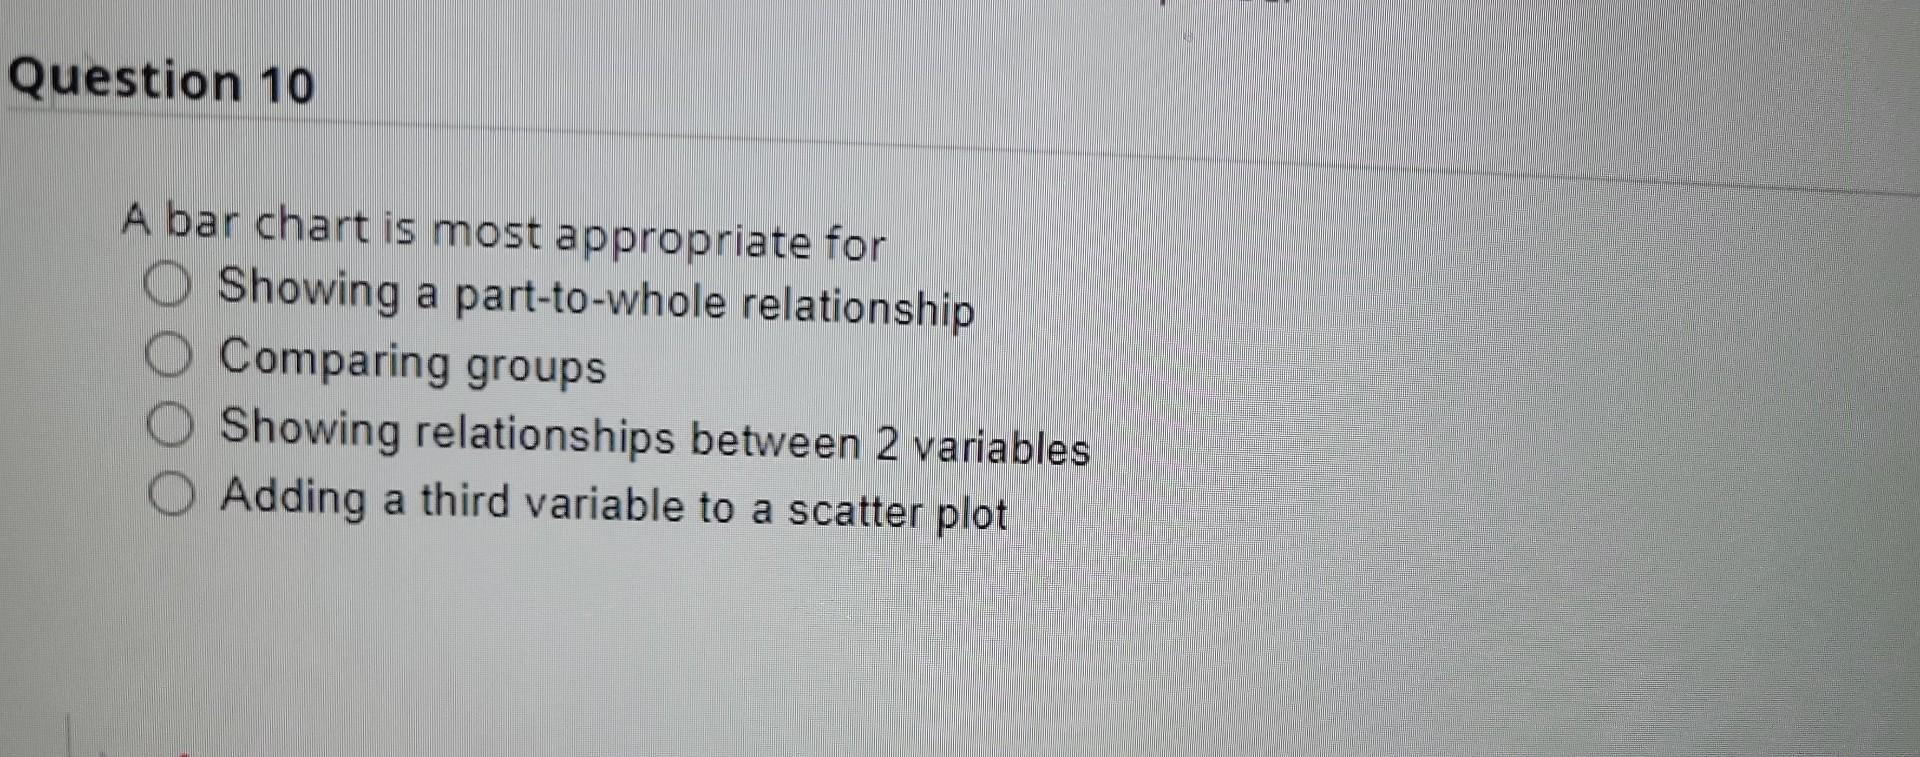
Moving to another question will save this response. Question 8 When you want to compare groups on certain characteristics, at least one variable must be Categorical Discrete Continuous Moving to another question will save this response. Moving to another question will save this response. Question 9 To show the trend over time in a chart, the variable on the vertical axis must be Categorical, bar chart and you should use a Qualitative, pie chart Quantitative, line chart Moving to another question will save this response. A bar chart is most appropriate for Showing a part-to-whole relationship Comparing groups Showing relationships between 2 variables Adding a third variable to a scatter plot
Step by Step Solution
There are 3 Steps involved in it

Get step-by-step solutions from verified subject matter experts