

Question: Moving to the next question prevents changes to this answer. Question 20 Refer to the figure above. Which graph is a better approximation of average

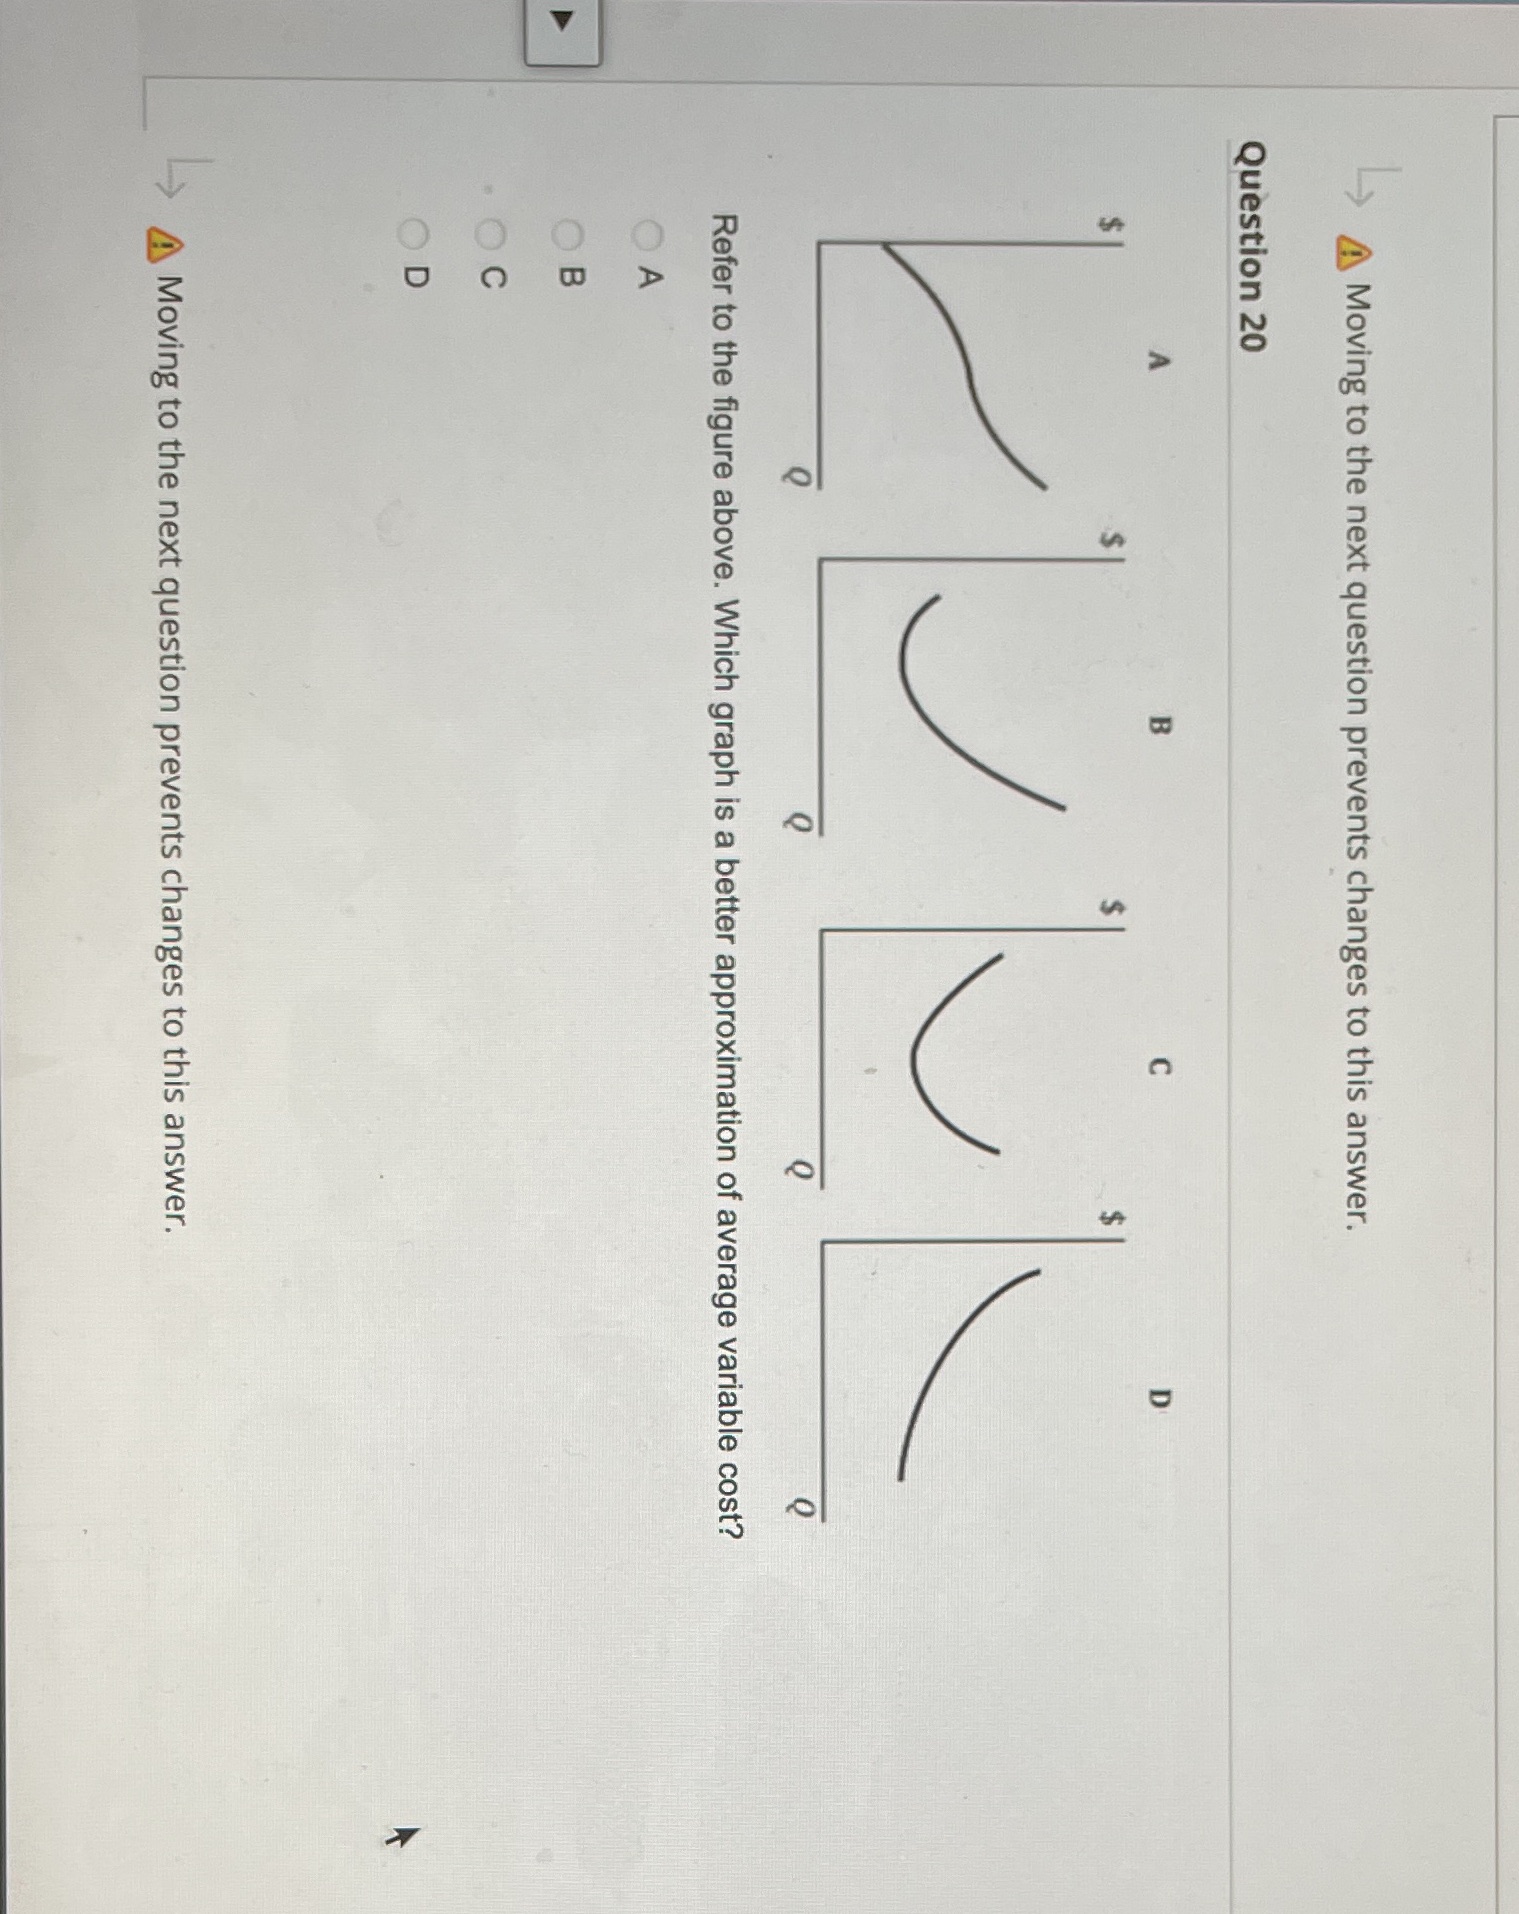
Moving to the next question prevents changes to this answer. Question 20 Refer to the figure above. Which graph is a better approximation of average variable cost? . OC OD > Moving to the next question prevents changes to this
Step by Step Solution
There are 3 Steps involved in it
1 Expert Approved Answer
Step: 1 Unlock

Question Has Been Solved by an Expert!
Get step-by-step solutions from verified subject matter experts
Step: 2 Unlock
Step: 3 Unlock