

Question: moving_average_vb_data_3: import matplotlib.pyplot as plt import random def main(): alist = [ ] blist = [ ] clist = [ ] dlist = [ ]
moving_average_vb_data_3:
import matplotlib.pyplot as plt
import random
def main():
alist = [ ]
blist = [ ]
clist = [ ]
dlist = [ ]
elist = []
flist = []
size = int(input("enter size of original list"))
tplot=int(input("enter 1 for scatter plot, 2 for line plot"))
for i in range (0,size):
xx = -10 + random.randint(0,20)
yy = -10 + random.randint(0,20)
xx1 = i +20
yy1 = i +20
if (tplot == 1):
plt.plot(xx, yy, 'o', color='black')
# xx = i
# yy = i
alist.append(xx)
blist.append(yy)
elist.append(xx1)
flist.append(yy1)
# print(alist,blist)
if(tplot == 2):
plt.plot(alist,blist)
#order the points in increasing horizontal coordinate
for k in range (0,size):
for j in range (k,size):
if (alist[k] >= alist[j]):
temp = alist[k]
alist[k] = alist[j]
alist[j] = temp
temp1 = blist[k]
blist[k] = blist[j]
blist[j] = temp1
# print(alist)
# print(blist)
# input("press enter when ready to plot")
if (tplot == 2):
plt.plot(alist,blist)
# plt.show()
ind =int(input("enter ind =1 to plot only last smoothed curve, 0 for all smoothed curves"))
num =int(input("enter number of moving averages"))
# perform num moving averages
# restore the first and last points from previous list so the list is not shortened
for j in range (1,num+1):
for kk in range (1,size-1):
yy = (blist[kk-1] +blist[kk] +blist[kk+1])/3
clist.append(yy)
dlist.append(alist[kk])
# restore beginning and end points from previous list into smoothed list
clist.insert(0,blist[0])
dlist.insert(0,alist[0])
clist.insert(len(blist)-1,blist[size-1])
dlist.insert(len(alist)-1,alist[size-1])
if ((j == num) and (ind == 1) ):
plt.plot(dlist,clist)
if ( ind == 0):
plt.plot(dlist,clist)
# reinitialize the lists-- blist gets the last smoothed curve, clist
blist = clist
alist = dlist
# reset clist and dlist to empty lists
clist = [ ]
dlist = [ ]
size = len(blist)
# print(blist)
# print(alist)
plt.plot(elist,flist)
plt.show()
main()
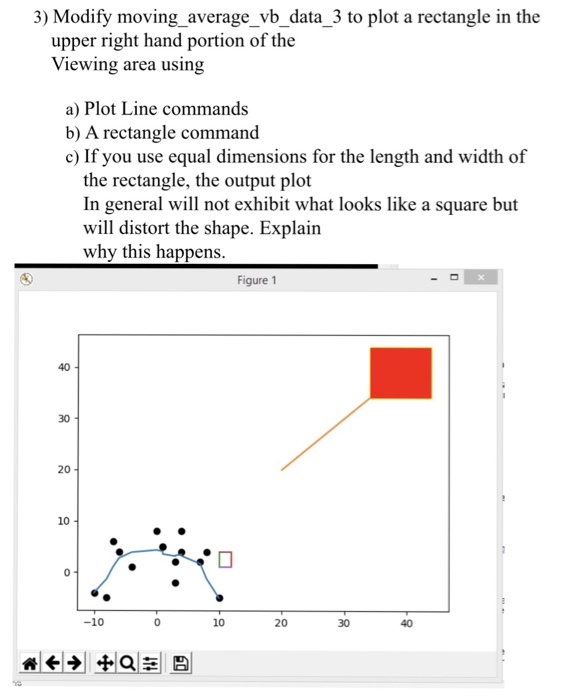
3) Modify moving_average_vb_data_3 to plot a rectangle in the upper right hand portion of the Viewing area using a) Plot Line commands b) A rectangle command c) If you use equal dimensions for the length and width of the rectangle, the output plot In general will not exhibit what looks like a square but will distort the shape. Explain why this happens Figure 1 40 30 20 10 -10 10 20 30 40
Step by Step Solution
There are 3 Steps involved in it
1 Expert Approved Answer
Step: 1 Unlock

Question Has Been Solved by an Expert!
Get step-by-step solutions from verified subject matter experts
Step: 2 Unlock
Step: 3 Unlock