

Question: Mr. Guerrero's class collected data on the length (in cm) and the time (in seconds) the pendulum took to complete one period.After making a scatterplot
Mr. Guerrero's class collected data on the length (in cm) and the time (in seconds) the pendulum took to complete one period.After making a scatterplot of x = length and y = time, it was determined that a linear model would not be appropriate for these data.
(a)A scatterplot of the logarithm of the period versus the logarithm of the length is shown below.Does this graph suggest that the relationship between time and count can be modeled by an exponential function or by a power function?Explain.
(b) Computer output from the regression of log(period) versus log(length) is given below.State the equation of the least-squares regression line for the transformed data.
(c)Use your model to predict the period for a pendulum with a length of 70 cm.
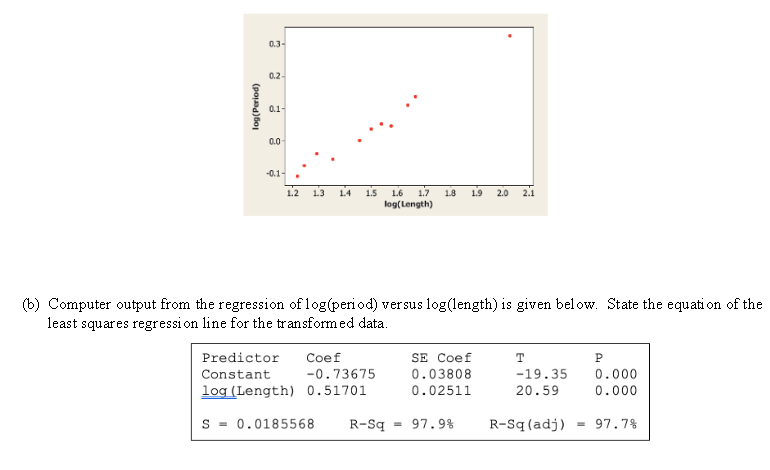
0.3 0.2 log (Period) 0.1 0.0 -0.1 - 12 13 14 15 16 1.7 18 19 2.0 2.1 log( Length) (b) Computer output from the regression of log(period) versus log (length) is given below. State the equation of the least squares regression line for the transformed data. Predictor Coef SE Coef T P Constant -0. 73675 0. 03808 -19.35 0. 000 log (Length) 0.51701 0 . 02511 20.59 0.000 S = 0. 0185568 R-Sq = 97.9% R-Sq(adj) = 97.7%
Step by Step Solution
There are 3 Steps involved in it

Get step-by-step solutions from verified subject matter experts