

Question: The swinging pendulum Mrs. Hanrahan's precalculus class collected data on the length (in centimeters) of a pendulum and the time (in seconds) the pendulum took
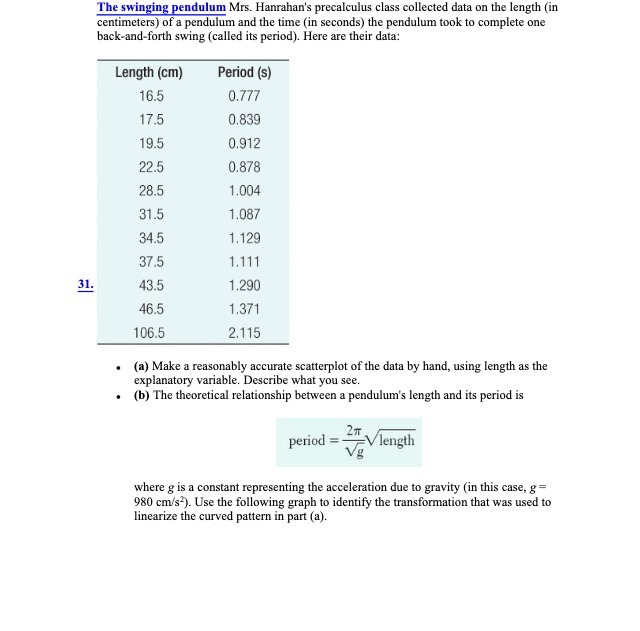
The swinging pendulum Mrs. Hanrahan's precalculus class collected data on the length (in centimeters) of a pendulum and the time (in seconds) the pendulum took to complete one back-and-forth swing (called its period). Here are their data: Length (cm) Period (s) 16.5 0.777 17.5 0.839 19.5 0.912 22.5 0.878 28.5 1.004 31.5 1.087 34.5 1.129 37.5 1.111 31. 43.5 1.290 46.5 1.371 106.5 2.115 (a) Make a reasonably accurate scatterplot of the data by hand, using length as the explanatory variable. Describe what you see. (b) The theoretical relationship between a pendulum's length and its period is period = Vlength Vg where g is a constant representing the acceleration due to gravity (in this case, g = 980 cm/s-). Use the following graph to identify the transformation that was used to linearize the curved pattern in part (a)
Step by Step Solution
There are 3 Steps involved in it

Get step-by-step solutions from verified subject matter experts