

Question: Mr.?Jones andMrs.?Smith both teach3rd?grade mathematics. The following data represents scoreson?a recent math test. Lookingat?the two setsof?scores, which class did better? Which class would you preferto?teach?
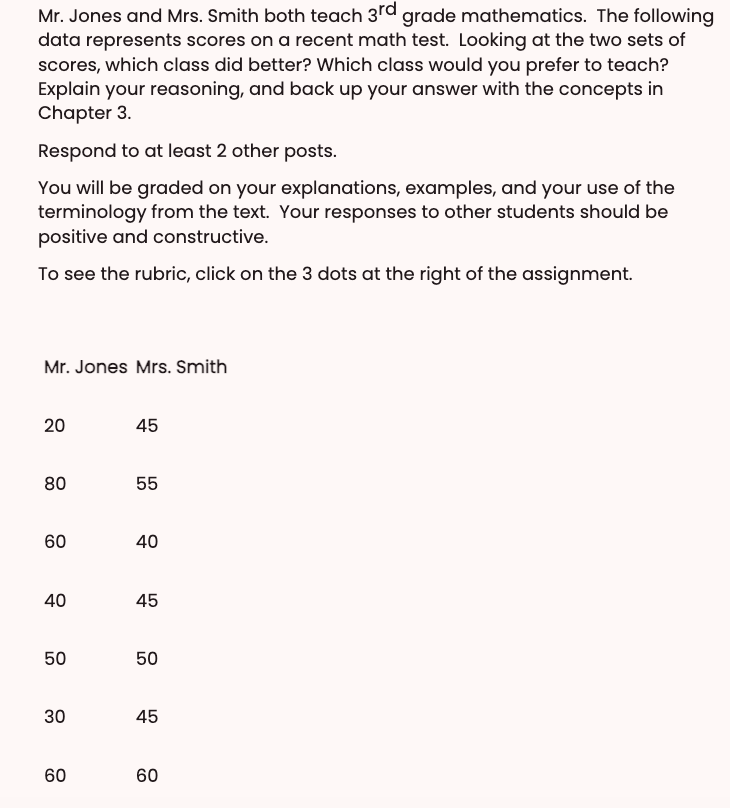
Mr.?Jones andMrs.?Smith both teach3rd?grade mathematics. The following data represents scoreson?a recent math test. Lookingat?the two setsof?scores, which class did better? Which class would you preferto?teach? Explain your reasoning, and backup?your answer with the conceptsin?Chapter3.
***The?conceptsin?Chapter3?are howto?organize raw data into frequency distributions and graphs. Chapter3?shows the statistical methods that canbe?usedto?summarize data. You willbe?finding measuresof?central tendency, suchas?mean, median, and mode.In?additionto?knowing the average, you must also know how the datais?dispersed. The measures that determine the spreadof?the data values are called measuresof?variation. These measures include the range, variance, and standard deviation. Another setof?measuresis?also necessaryto?describe data, these are called measuresof?position. You willbe?learning howto?find and interpret percentiles, deciles, and quartiles. Finally, you will learn a technique knownas?exploratory data analysis. You will see howto?create a box-plot and the five-number summary, and howto?identify outliers.
Scores(data)?are attachedas?a file too**
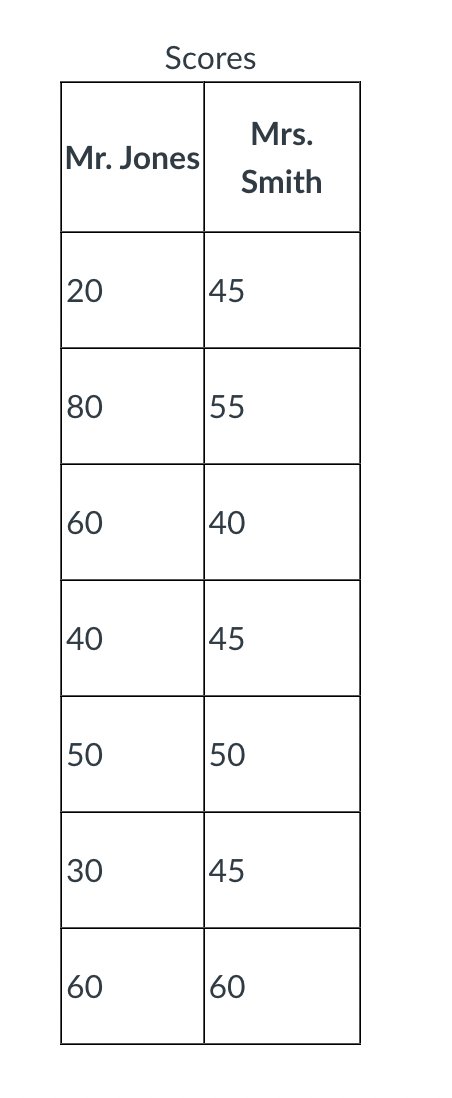
Mr?Jones:
20
80
60
40
50
30
60
Mrs.?Smith
45
55
40
45
50
45
60
Step by Step Solution
There are 3 Steps involved in it

Get step-by-step solutions from verified subject matter experts