Question: MS Excel can be used for many statistical functions, including forecasting. Scoring breakdown as follows: For each product line, develop the forecast for Month 35


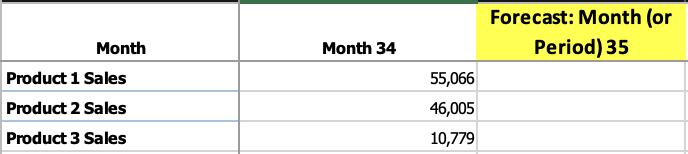
MS Excel can be used for many statistical functions, including forecasting. Scoring breakdown as follows: For each product line, develop the forecast for Month 35 (0.5 points) Use the data from Month 1 to Month 34 (0.5 points) Add trend line for each product line (0.5 points) Use the software to display the regression equation on the chart for each product line (0.5 points) To earn full credit, the submission shall be submitted as a MS Excel file. Data spreadsheet is attached below. Month Month 1 Month 2 Month 3 Month 4 Month 5 Month 6 Month 7 Month 8 Month 9 Month 10 Month 11 Product 1 Sales 36,126 30,944 25,387 7,958 Product 2 Sales 37,008 31,404 12,559 31,106 27,457 4,696 31,136 22,719 43,457 33,447 10,511 33,979 29,464 4,489 35,632 27,898 14,640 45,316 35,925 6,945 29,220 32,608 26,861 9,628 40,146 35,872 11,866 Product 3 Sales 10,316 7,791 Month Month 12 Month 13 Month 14 Month 15 Month 16 Month 17 Month 18 Month 19 Month 20 Month 21 Month 22 Product 1 Sales 48,319 42,120 41,916 39,658 6,503 Product 2 Sales Product 3 Sales 38,151 29,145 7,445 44,533 34,260 14,066 34,917 29,022 7,250 33,346 28,082 13,265 41,246 43,902 32,682 13,153 35,326 15,363 50,287 43,191 14,073 41,746 35,453 9,404 36,701 32,211 11,295 10,394 Month Month 23 Month 24 Month 25 Month 26 Month 27 Month 28 Month 29 Month 30 Month 31 Month 32 Month 33 Product 1 Sales 45,968 41,709 45,831 34,645 14,394 38,023 32,800 13,207 45,874 33,282 11,900 Product 2 Sales 40,254 32,944 8,706 43,553 31,888 48,520 37,210 49,980 37,760 12,456 43,185 35,577 12,837 53,619 45,305 52,873 47,294 8,979 Product 3 Sales 13,961 15,179 16,765 10,385 Forecast: Month (or Period) 35 Month 34 Month Product 1 Sales Product 2 Sales Product 3 Sales 55,066 46,005 10,779 MS Excel can be used for many statistical functions, including forecasting. Scoring breakdown as follows: For each product line, develop the forecast for Month 35 (0.5 points) Use the data from Month 1 to Month 34 (0.5 points) Add trend line for each product line (0.5 points) Use the software to display the regression equation on the chart for each product line (0.5 points) To earn full credit, the submission shall be submitted as a MS Excel file. Data spreadsheet is attached below. Month Month 1 Month 2 Month 3 Month 4 Month 5 Month 6 Month 7 Month 8 Month 9 Month 10 Month 11 Product 1 Sales 36,126 30,944 25,387 7,958 Product 2 Sales 37,008 31,404 12,559 31,106 27,457 4,696 31,136 22,719 43,457 33,447 10,511 33,979 29,464 4,489 35,632 27,898 14,640 45,316 35,925 6,945 29,220 32,608 26,861 9,628 40,146 35,872 11,866 Product 3 Sales 10,316 7,791 Month Month 12 Month 13 Month 14 Month 15 Month 16 Month 17 Month 18 Month 19 Month 20 Month 21 Month 22 Product 1 Sales 48,319 42,120 41,916 39,658 6,503 Product 2 Sales Product 3 Sales 38,151 29,145 7,445 44,533 34,260 14,066 34,917 29,022 7,250 33,346 28,082 13,265 41,246 43,902 32,682 13,153 35,326 15,363 50,287 43,191 14,073 41,746 35,453 9,404 36,701 32,211 11,295 10,394 Month Month 23 Month 24 Month 25 Month 26 Month 27 Month 28 Month 29 Month 30 Month 31 Month 32 Month 33 Product 1 Sales 45,968 41,709 45,831 34,645 14,394 38,023 32,800 13,207 45,874 33,282 11,900 Product 2 Sales 40,254 32,944 8,706 43,553 31,888 48,520 37,210 49,980 37,760 12,456 43,185 35,577 12,837 53,619 45,305 52,873 47,294 8,979 Product 3 Sales 13,961 15,179 16,765 10,385 Forecast: Month (or Period) 35 Month 34 Month Product 1 Sales Product 2 Sales Product 3 Sales 55,066 46,005 10,779


