

Question: Multiple choice Suppose the figure below plots the marginal and average individual income tax rates in a country A. Which of the following statements is
Multiple choice
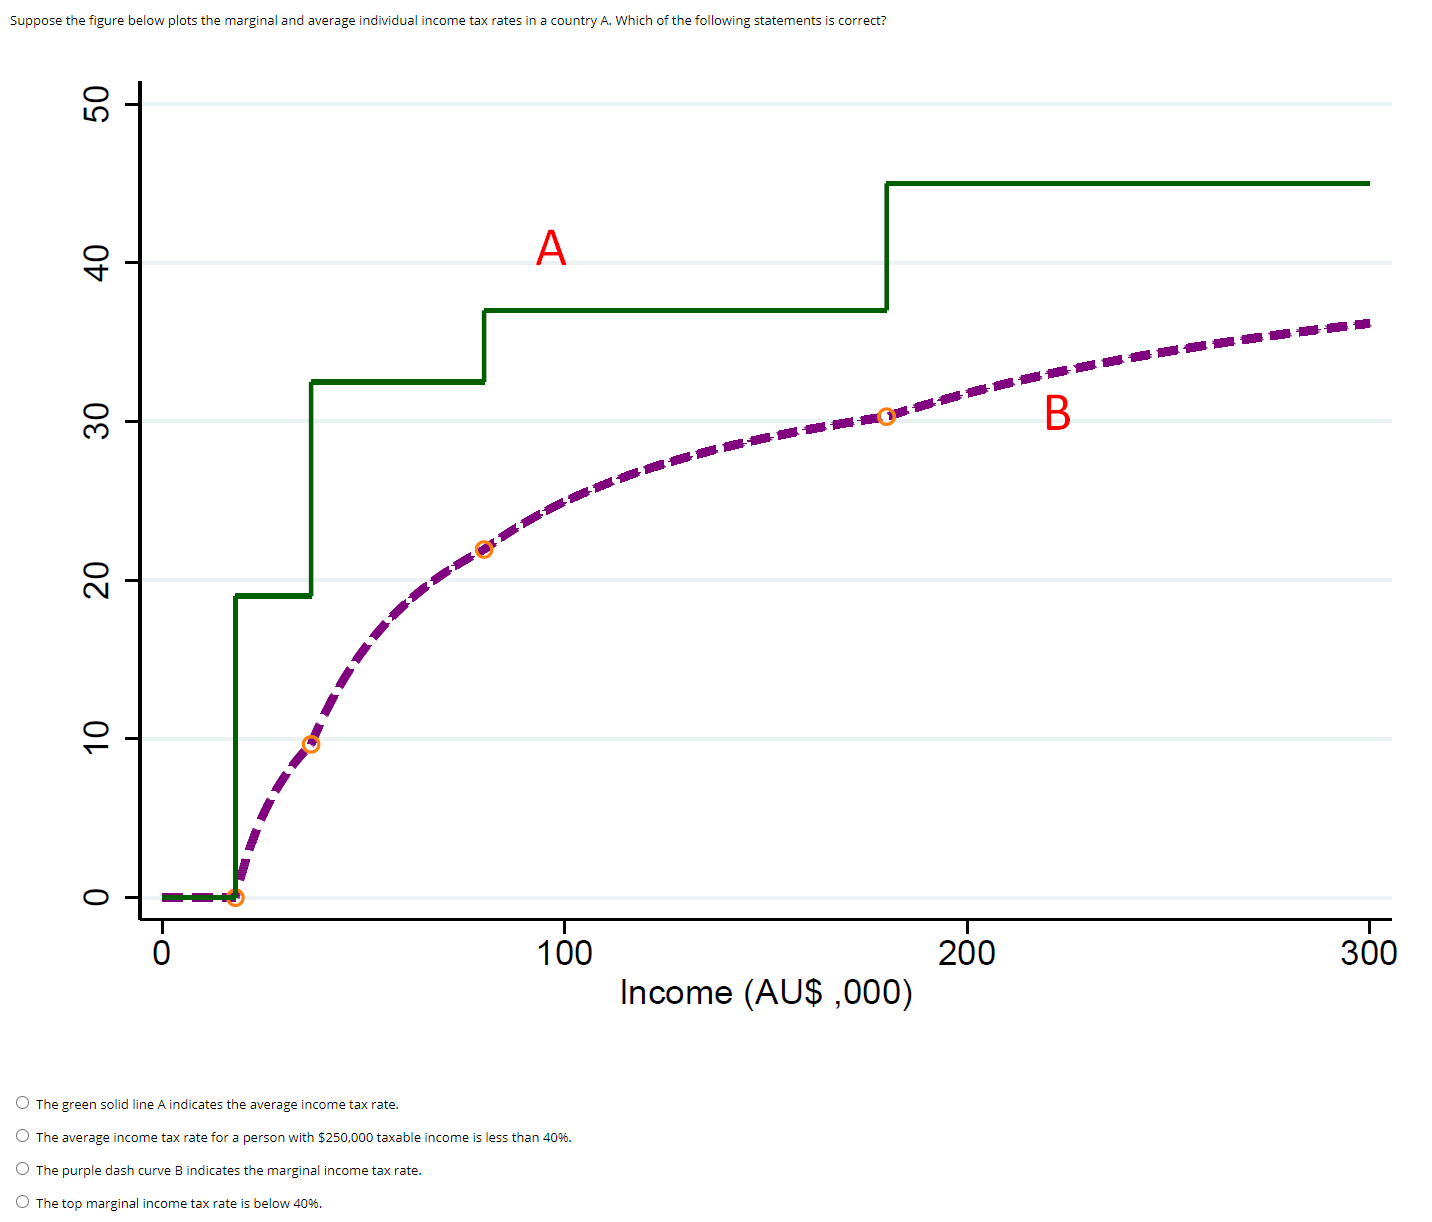
Suppose the figure below plots the marginal and average individual income tax rates in a country A. Which of the following statements is correct? 9 - A 8 - O 100 200 300 Income (AU$ ,000) O The green solid line A indicates the average income tax rate. O The average income tax rate for a person with $250,000 taxable income is less than 409%. The purple dash curve B indicates the marginal income tax rate. The top marginal income tax rate is below 409%
Step by Step Solution
There are 3 Steps involved in it
1 Expert Approved Answer
Step: 1 Unlock

Question Has Been Solved by an Expert!
Get step-by-step solutions from verified subject matter experts
Step: 2 Unlock
Step: 3 Unlock