

Question: multiple part question The data in the table was collected for a certain enzyme-catalyzed reaction. Use these data to determine the maximum rate of the
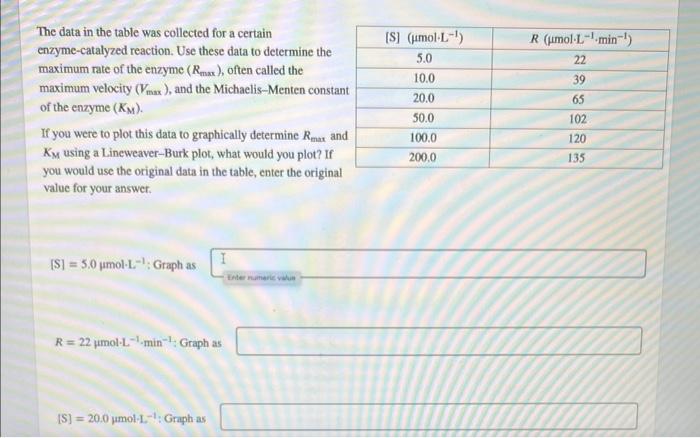
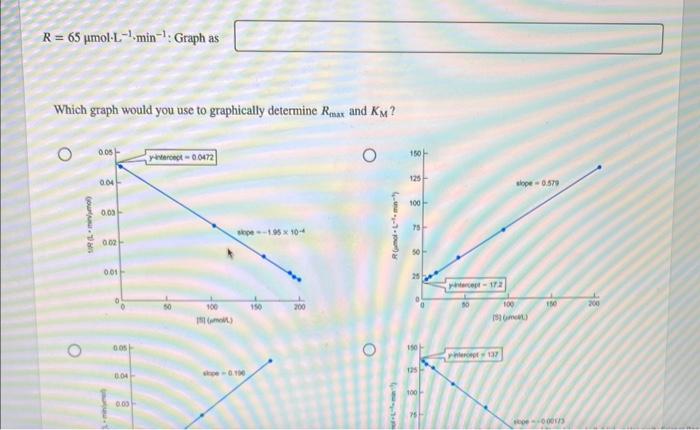
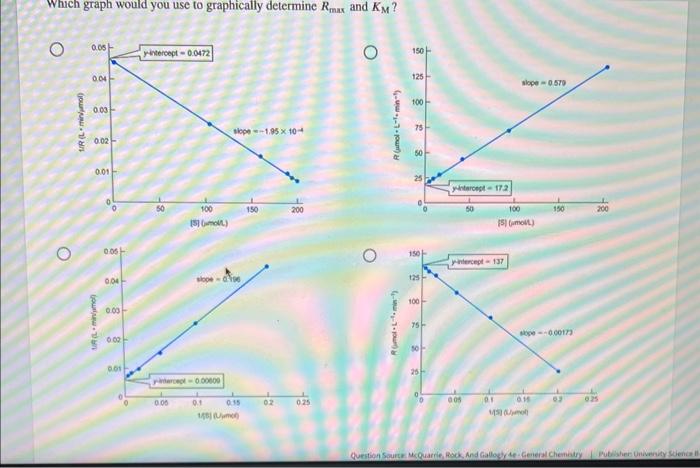
The data in the table was collected for a certain enzyme-catalyzed reaction. Use these data to determine the maximum rate of the enzyme (Rmax), often called the maximum velocity (Vmax), and the Michaelis-Menten constant of the enzyme (KM). If you were to plot this data to graphically determine Rmax and KM using a Lineweaver-Burk plot, what would you plot? If you would use the original dats in the table, enter the original value for your answer. [S]=5.0molL1:Graphas R=22molL1min1:Graphas [S}=20.0 umol-L,-1. Graph as R=65molL1min1:Graphas Which graph would you use to graphically determine Rmax and KM ? Which graph would you use to graphically determine Rmax and KM
Step by Step Solution
There are 3 Steps involved in it

Get step-by-step solutions from verified subject matter experts