

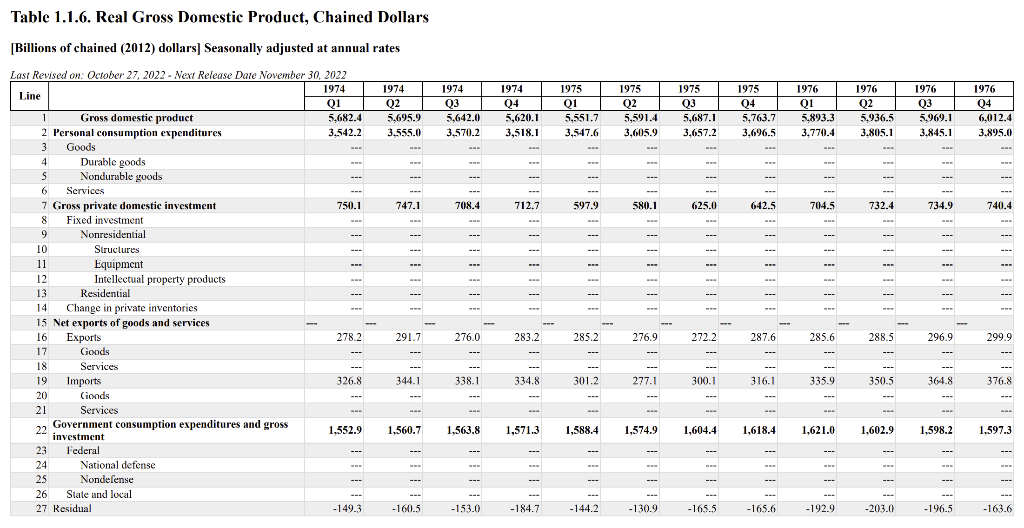
Question: Multiple parts to a chart that is provided. Please help thanks! Table 1.1.6. Real Gross Domestic Product, Chained Dollars [Billions of chained (2012) dollars] Seasonally
![1.1.6. Real Gross Domestic Product, Chained Dollars [Billions of chained (2012) dollars]](https://dsd5zvtm8ll6.cloudfront.net/si.experts.images/questions/2024/10/6716455db52fb_7976716455d043de.jpg)
 Multiple parts to a chart that is provided. Please help thanks!
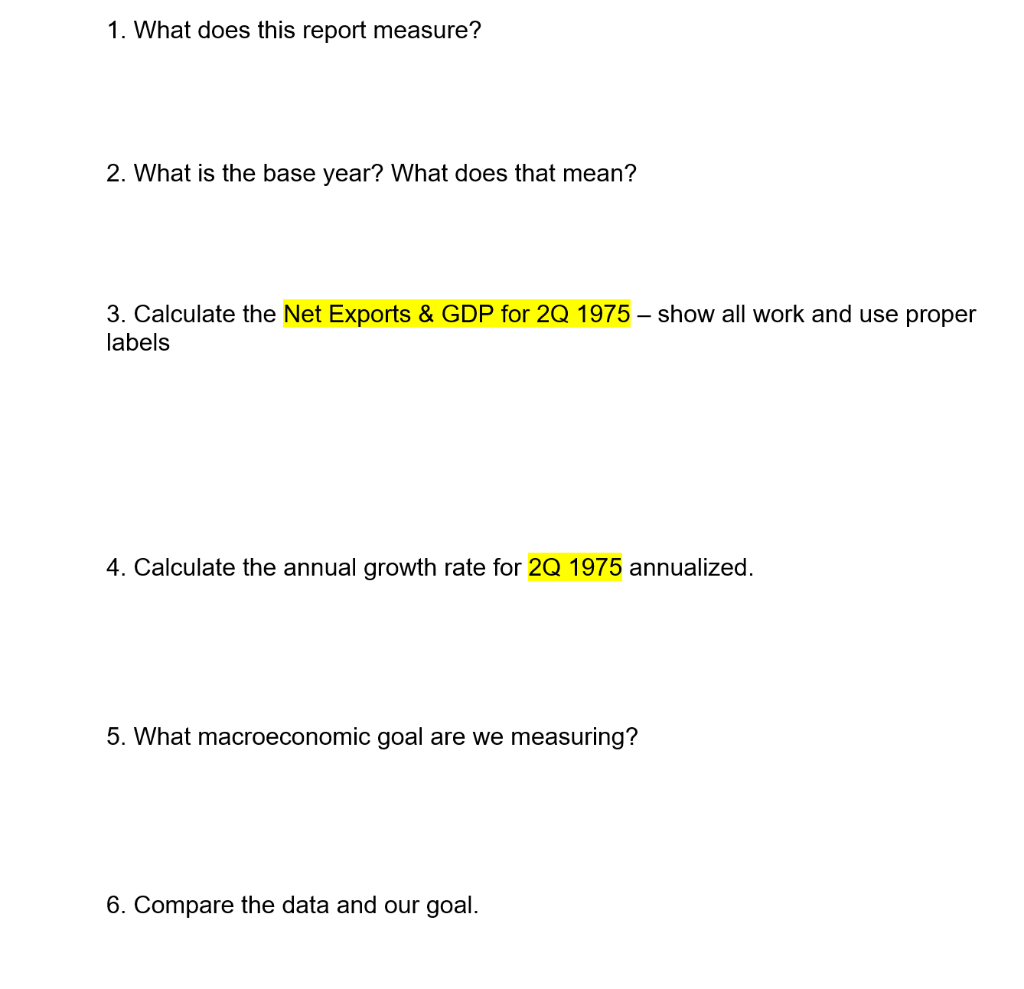
Table 1.1.6. Real Gross Domestic Product, Chained Dollars [Billions of chained (2012) dollars] Seasonally adjusted at annual rates 1. What does this report measure? 2. What is the base year? What does that mean? 3. Calculate the Net Exports \& GDP for 2Q 1975 - show all work and use proper labels 4. Calculate the annual growth rate for 2Q 1975 annualized. 5. What macroeconomic goal are we measuring? 6. Compare the data and our goal. 7. What phase of the business cycle do you predict the economy is in during this time period? Support your decision. 8. What other economic indicators would you need to make a more information decision for \#7. 10. Draw the current location of the Economy on the PPC. Table 1.1.6. Real Gross Domestic Product, Chained Dollars [Billions of chained (2012) dollars] Seasonally adjusted at annual rates 1. What does this report measure? 2. What is the base year? What does that mean? 3. Calculate the Net Exports \& GDP for 2Q 1975 - show all work and use proper labels 4. Calculate the annual growth rate for 2Q 1975 annualized. 5. What macroeconomic goal are we measuring? 6. Compare the data and our goal. 7. What phase of the business cycle do you predict the economy is in during this time period? Support your decision. 8. What other economic indicators would you need to make a more information decision for \#7. 10. Draw the current location of the Economy on the PPC
Step by Step Solution
There are 3 Steps involved in it

Get step-by-step solutions from verified subject matter experts