

Question: MUST USE EXCEL AND WRITE DOWN THE STEPS IN FINDING, AND PASTE THE excel functions, here is the data set, the google spreadsheet link https://docs.google.com/spreadsheets/d/1xYVei7P6GmHNWAIV9T507YBiXjQ07vixNa3iXczdtr8/edit?usp=sharing
MUST USE EXCEL AND WRITE DOWN THE STEPS IN FINDING, AND PASTE THE excel functions, here is the data set, the google spreadsheet link
https://docs.google.com/spreadsheets/d/1xYVei7P6GmHNWAIV9T507YBiXjQ07vixNa3iXczdtr8/edit?usp=sharing
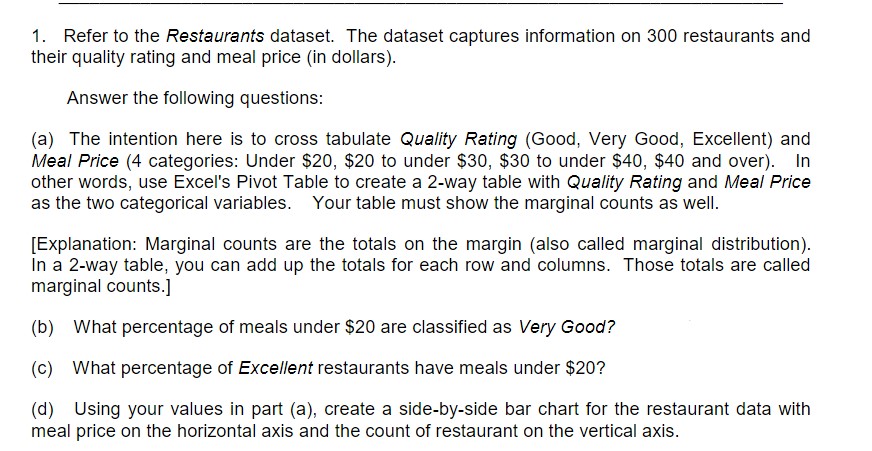
1. Refer to the Restaurants dataset. The dataset captures information on 300 restaurants and their quality rating and meal price (in dollars). Answer the following questions: (a) The intention here is to cross tabulate Quality Rating (Good, Very Good, Excellent) and Meal Price (4 categories: Under $20, $20 to under $30, $30 to under $40, $40 and over). In other words, use Excel's Pivot Table to create a 2-way table with Quality Rating and Meal Price as the two categorical variables. Your table must show the marginal counts as well. [Explanation: Marginal counts are the totals on the margin (also called marginal distribution). In a 2-way table, you can add up the totals for each row and columns. Those totals are called marginal counts.] (b) What percentage of meals under $20 are classified as Very Good? (c) What percentage of Excellent restaurants have meals under $20? (d) Using your values in part (a), create a side-by-side bar chart for the restaurant data with meal price on the horizontal axis and the count of restaurant on the vertical axis
Step by Step Solution
There are 3 Steps involved in it

Get step-by-step solutions from verified subject matter experts