

Question: My computer is down and it is on my computer so I can't be able to show you in tabular format Foreign Born (%) No
My computer is down and it is on my computer so I can't be able to show you in tabular format
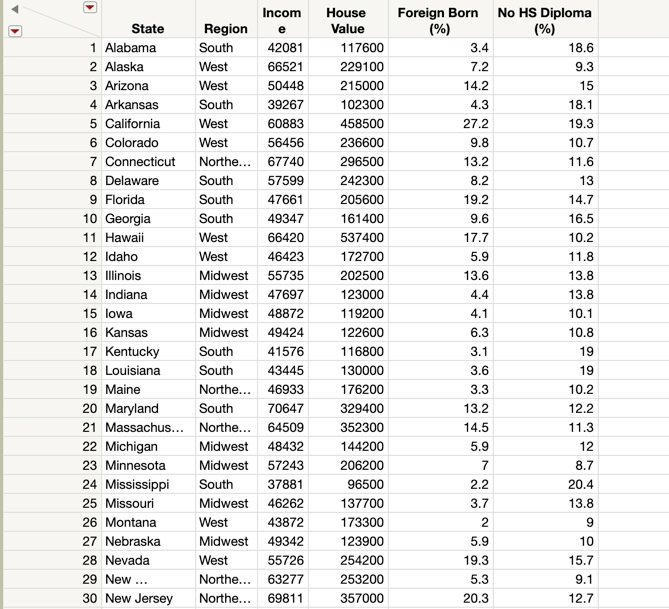
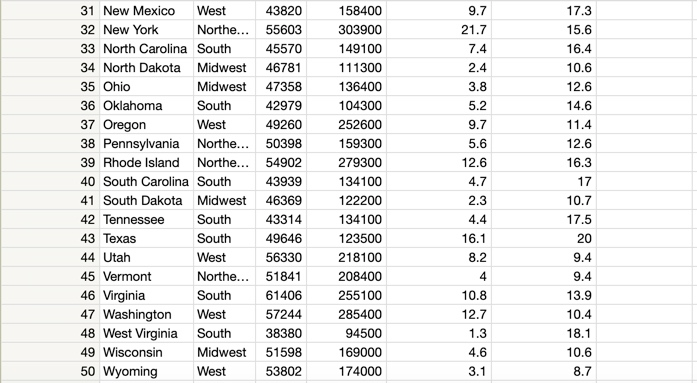
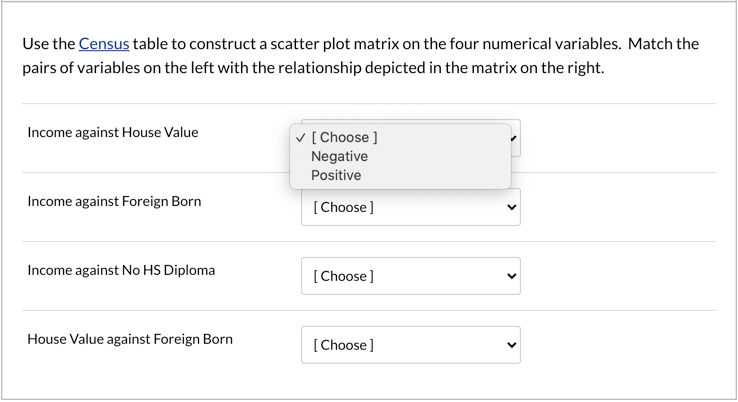
Foreign Born (%) No HS Diploma (%) 18.6 9.3 3.4 7.2 15 14.2 4.3 27.2 9.8 13.2 18.1 19.3 10.7 11.6 13 14.7 16.5 10.2 8.2 19.2 9.6 11.8 Incom State Region e 1 Alabama South 42081 2 Alaska West 66521 3 Arizona West 50448 4 Arkansas South 39267 5 California West 60883 6 Colorado West 56456 7 Connecticut Northe... 67740 8 Delaware South 57599 9 Florida South 47661 10 Georgia South 49347 11 Hawaii West 66420 12 Idaho West 46423 13 Illinois Midwest 55735 14 Indiana Midwest 47697 15 lowa Midwest 48872 16 Kansas Midwest 49424 17 Kentucky South 41576 18 Louisiana South 43445 19 Maine Northe... 46933 20 Maryland South 70647 21 Massachus... Northe... 64509 22 Michigan Midwest 48432 23 Minnesota Midwest 57243 24 Mississippi South 37881 25 Missouri Midwest 46262 26 Montana West 43872 27 Nebraska Midwest 49342 28 Nevada West 55726 29 New ... Northe... 63277 30 New Jersey Northe... 69811 House Value 117600 229100 215000 102300 458500 236600 296500 242300 205600 161400 537400 172700 202500 123000 119200 122600 116800 130000 176200 329400 352300 144200 206200 96500 137700 173300 123900 254200 253200 357000 17.7 5.9 13.6 4.4 4.1 6.3 3.1 3.6 3.3 13.8 13.8 10.1 10.8 19 19 10.2 13.2 12.2 14.5 11.3 12 5.9 7 8.7 2.2 3.7 2 5.9 19.3 5.3 20.4 13.8 9 10 15.7 9.1 20.3 12.7 158400 303900 149100 111300 9.7 21.7 7.4 2.4 3.8 5.2 17.3 15.6 16.4 10.6 12.6 9.7 5.6 12.6 4.7 31 New Mexico West 43820 32 New York Northe... 55603 33 North Carolina South 45570 34 North Dakota Midwest 46781 35 Ohio Midwest 47358 36 Oklahoma South 42979 37 Oregon West 49260 38 Pennsylvania Northe... 50398 39 Rhode Island Northe... 54902 40 South Carolina South 43939 41 South Dakota Midwest 46369 42 Tennessee South 43314 43 Texas South 49646 44 Utah West 56330 45 Vermont Northe... 51841 46 Virginia South 61406 47 Washington West 57244 48 West Virginia South 38380 49 Wisconsin Midwest 51598 50 Wyoming West 53802 136400 104300 252600 159300 279300 134100 122200 134100 123500 218100 208400 255100 285400 94500 169000 174000 2.3 4.4 16.1 8.2 14.6 11.4 12.6 16.3 17 10.7 17.5 20 9.4 9.4 13.9 10.4 4 10.8 12.7 1.3 4.6 18.1 10.6 8.7 3.1 Use the Census table to construct a scatter plot matrix on the four numerical variables. Match the pairs of variables on the left with the relationship depicted in the matrix on the right. Income against House Value [Choose ] Negative Positive [Choose) Income against Foreign Born Income against No HS Diploma [Choose]Step by Step Solution
There are 3 Steps involved in it
1 Expert Approved Answer
Step: 1 Unlock

Question Has Been Solved by an Expert!
Get step-by-step solutions from verified subject matter experts
Step: 2 Unlock
Step: 3 Unlock