

Question: My current code: f1=@(x)(exp(-x.^2));%f1 datx=(-3:1:3)';%datapoints daty=f1(datx); x=(-3:.1:3)';%interpolation points P1=Lagrange_poly(x,datx,daty)%Test P1 f2=@(x)(1./(1+x.^2));%f2 daty=f2(datx); P2=Lagrange_poly(x,datx,daty)%Test P2 datx=-3:.5:3;%other data points daty=f1(datx); P3=Lagrange_poly(x,datx,daty)%Test P3 daty=f2(datx); P4=Lagrange_poly(x,datx,daty) %PLOT fplot(f1,[-3,3]); hold
 My current code:
f1=@(x)(exp(-x.^2));%f1
datx=(-3:1:3)';%datapoints
daty=f1(datx);
x=(-3:.1:3)';%interpolation points
P1=Lagrange_poly(x,datx,daty)%Test P1
f2=@(x)(1./(1+x.^2));%f2
daty=f2(datx);
P2=Lagrange_poly(x,datx,daty)%Test P2
datx=-3:.5:3;%other data points
daty=f1(datx);
P3=Lagrange_poly(x,datx,daty)%Test P3
daty=f2(datx);
P4=Lagrange_poly(x,datx,daty)
%PLOT
fplot(f1,[-3,3]);
hold on
scatter(datx,f1(datx),'*')
scatter(x,P1,'d')
scatter(x,P3,'filled')
legend('f1(x)','data points','P1','P3')
title('for f1')
figure
fplot(f2,[-3,3],'r');
hold on
scatter(datx,f2(datx),'*')
scatter(x,P2,'d')
scatter(x,P4,'filled')
legend('f2(x)','data points','P2','P4')
title('for f2')
function y=Lagrange_poly(x,datx,daty)
m=length(datx);
ybar=zeros(size(x));
for k=1:numel(x)
result=0;
for i=1:m
term=daty(i);
for j=1:m
if i~=j
term=term*(x(k)-datx(j))/(datx(i)-datx(j));
end
end
result=result+term;
end
ybar(k)=result;
end
y=ybar;
end
Submission feedback:
![P2=Lagrange_poly(x,datx,daty)%Test P2 datx=-3:.5:3;%other data points daty=f1(datx); P3=Lagrange_poly(x,datx,daty)%Test P3 daty=f2(datx); P4=Lagrange_poly(x,datx,daty) %PLOT fplot(f1,[-3,3]);](https://dsd5zvtm8ll6.cloudfront.net/si.experts.images/questions/2024/09/66f2f72ede9ef_02266f2f72e7be0e.jpg) Please edit my code to fullfill submission requirements or completely write a new one if wrong. Thanks.
Please edit my code to fullfill submission requirements or completely write a new one if wrong. Thanks.
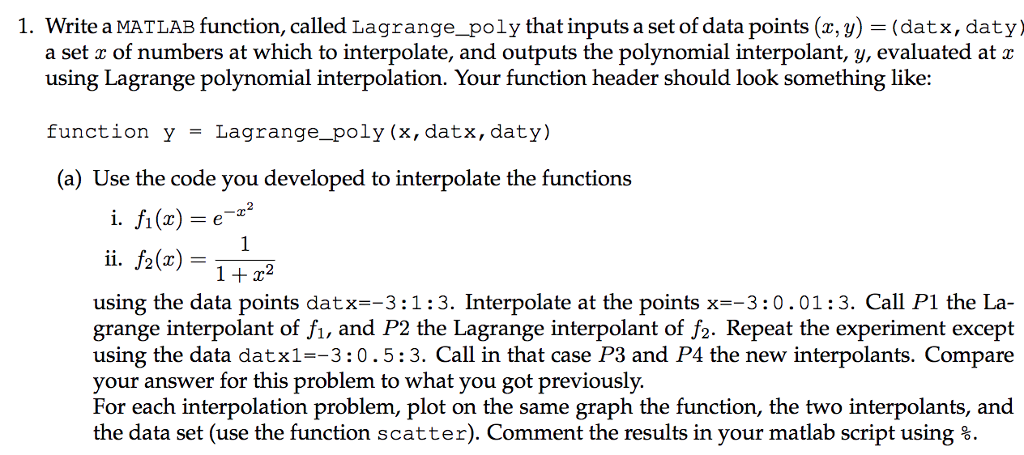
1. Write a MATLAB function, called Lagrange_poly that inputs a set of data points (x, y) (datx, daty) a set x of numbers at which to interpolate, and outputs the polynomial interpolant, y, evaluated at x using Lagrange polynomial interpolation. Your function header should look something like: function y = Lagrange-poly(x, datx, daty) (a) Use the code you developed to interpolate the functions i, fi (z)= e-z? ii. f2(x)= using the data points datx--3 : 1 :3. Interpolate at the points x=-3: 0.01 : 3. Call Pl the La- grange interpolant of fi, and P2 the Lagrange interpolant of f2. Repeat the experiment except using the data dat x1-3: 05: 3. Call in that case P3 and P4 the new interpolants. Compare r answer for this problem to what you got previously. For each interpolation problem, plot on the same graph the function, the two interpolants, and the data set (use the function scatter). Comment the results in your matlab script using %
Step by Step Solution
There are 3 Steps involved in it

Get step-by-step solutions from verified subject matter experts