

Question: My question isn't an assignment question but a question to understand SPSS statistics when creating descriptive tables (includes measures of central tendency, variation, and skewness
My question isn't an assignment question but a question to understand SPSS statistics when creating descriptive tables (includes measures of central tendency, variation, and skewness and kurtosis) for each continuous variable. Bar charts, histograms and correlations). When it comes to a research question. Would I only create data that is based on the research question only and what they're asking? I would really appreciate if someone can explain to me please. Thank you
You will use a hypothetical dataset 'Anti-inflammation drug and Covid-19 trial data Wi21 FE.xlsx', comparing the effectiveness of three anti-inflammation drugs/treatments in helping patients recover from Covid-19 (i.e., how long it takes to recover and be discharged from the hospital). Recovery is operationalized as length of stay in the hospital or number of days to be discharged from the hospital. In other words, we want to see which of these three drugs/treatments help patients recover fastest from Covid-19 using length of hospital stay as a proxy. (As we witnessed over the past year or so, hospitals are overwhelmed with Covid-19 patients and speedy recovery is critical.)
The independent/predictor variable is the Treatment with three randomly assigned group of Covid-19 patients: Group #1 received the standard treatment that includes the drug Dexamethasone, Group #2 received treatment that includes the new drug Tocilizumab, Group #3 received treatment that includes the new drug Sarilumab.
The dependent/outcome variable is recovery time, i.e., the number of days to be discharged from the hospital.
And dataset includes three additional variables that may make difference in recovery time regardless of drug/treatment they are receiving:
- Age (Age)
- Sex (Sex) (1=Female, 2=Male)
- Race/Ethnicity (1=Asian, 2=American Indian/Alaskan Native, 3=Black/African American, 4=Hispanic, 5=Native Hawaiian, 6=White, 7=Mixed race)
Question 1: If a research question states "How effective are three drugs/treatments in treating inflammation, therefore helping them recover from Covid-19? In other words, which drug/treatment group take longest and shortest to discharge from the hospital? (Is there a statistically significant difference in number of days Covid-19 patients take to discharge from the hospital based on drugs/treatments? If so, how do they differ and by how much do they differ?)
These are to answer the findings:
- Independent variable:
- Dependent variable:
- Ho:
- H1:
- Statistical analysis used:
- correlation coefficient
- normality
- linearity
- Assumptions:
- Accept or reject the Ho:
- Summary and conclusion:
Would create the data only based on treatment and the discharge since the research question is asking about it to answer the findings?
For example the data would be (below) would it be correct?
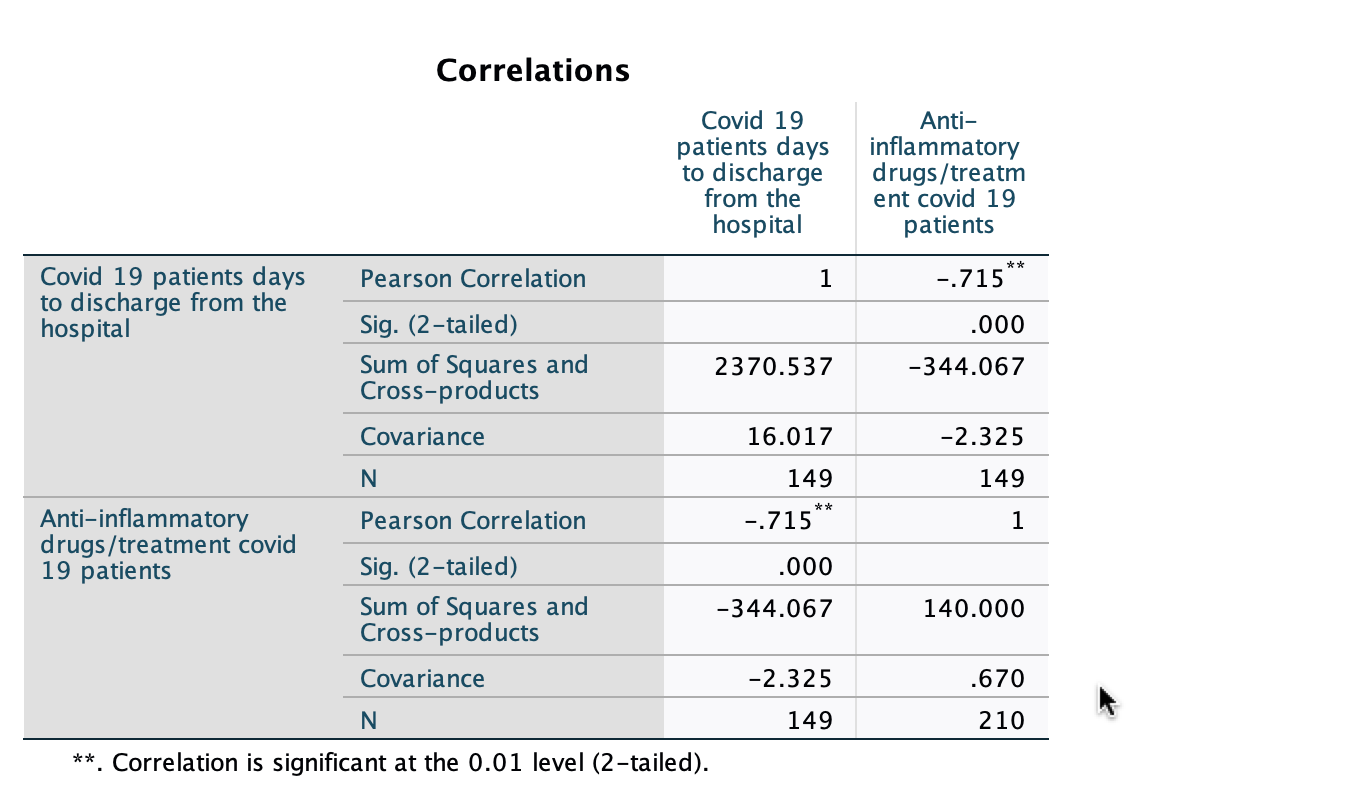
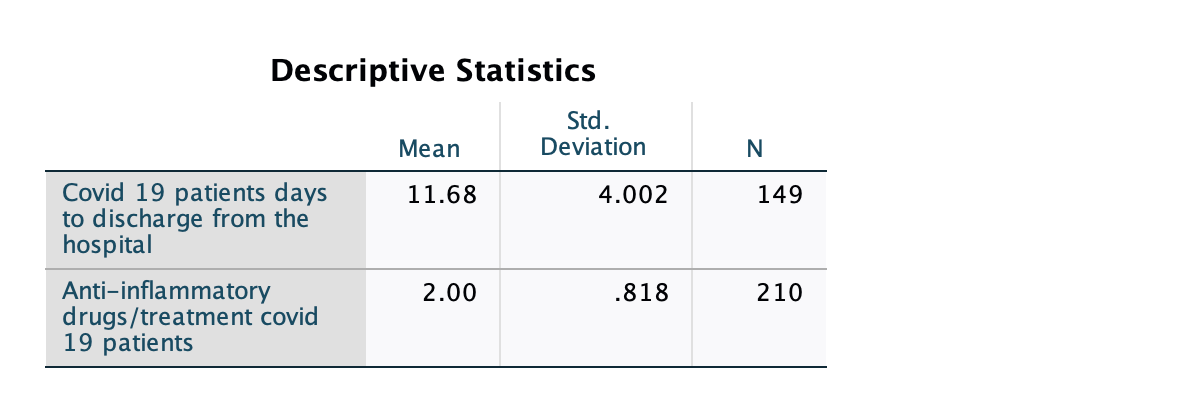
Correlations Covid 19 Anti- patients days inflammatory to discharge drugs /treatm from the ent covid 19 hospital patients Covid 19 patients days Pearson Correlation 1 -.715 * * to discharge from the hospital Sig. (2-tailed) .000 Sum of Squares and 2370.537 -344.067 Cross-products Covariance 16.017 -2.325 N 149 149 Anti-inflammatory Pearson Correlation -.715 1 drugs /treatment covid 19 patients Sig. (2-tailed) 000 Sum of Squares and -344.067 140.000 Cross-products Covariance -2.325 .670 N 149 210 **. Correlation is significant at the 0.01 level (2-tailed).Descriptive Statistics Std. Mean Deviation N Covid 19 patients days 11.68 4.002 149 to discharge from the hospital Anti-inflammatory 2.00 .818 210 drugs /treatment covid 19 patients\f
Step by Step Solution
There are 3 Steps involved in it

Get step-by-step solutions from verified subject matter experts