

Question: myopenmath.com/assess2/?ci Here is a sample data set. 268.1 269.1 274.5 281.2 294.5 298.1 305.1 306.7 307.2 314.7 320.1 334.1 337.6 337-6 337.6 338.8 339.1 340.7
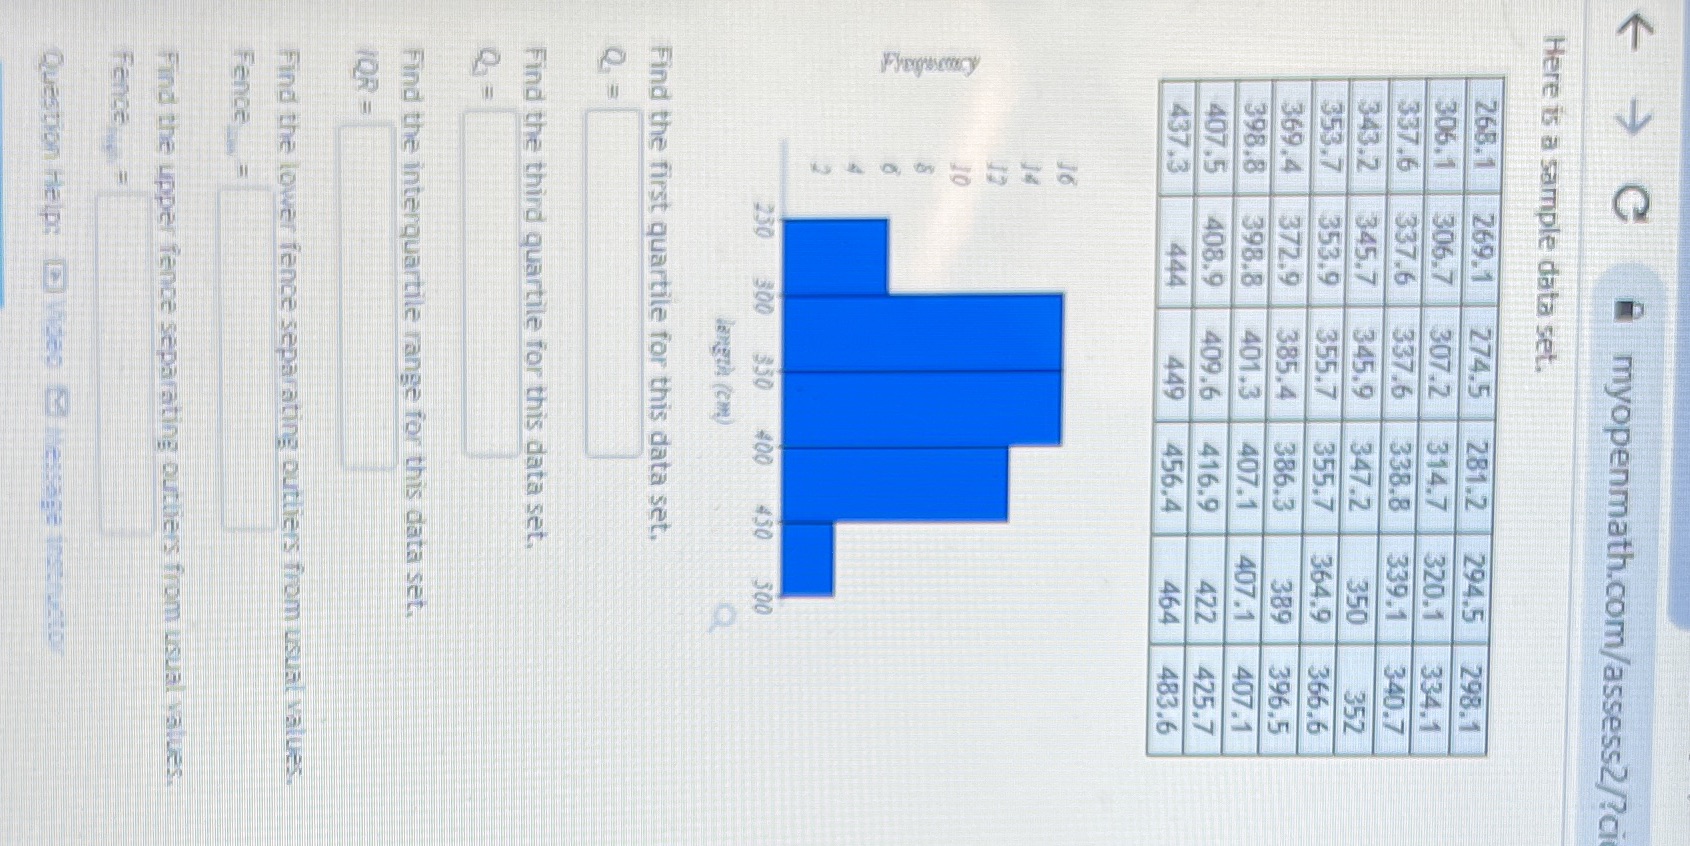
myopenmath.com/assess2/?ci Here is a sample data set. 268.1 269.1 274.5 281.2 294.5 298.1 305.1 306.7 307.2 314.7 320.1 334.1 337.6 337-6 337.6 338.8 339.1 340.7 343.2 345.7 345.9 347.2 350 352 353.7 353.9 355.7 355.7 364.9 366.6 369.4 372.9 385.4 386.3 389 396.5 398.8 398.8 401.3 407.1 407.1 407.1 407.5 408.9 409.6 416.9 422 425.7 437.3 444 449 456.4 464 483.6 230 300 350 430 300 O Margin (Cm) Find the first quartile for this data set, Find the third quartile for this data set. Find the interquartile range for this data set. IOR = Find the lower fence separating outliers from usual values. Fence Find the upper fence separating outliers from usual values. Fence Question Help: 12 theed B Hairare lost
Step by Step Solution
There are 3 Steps involved in it

Get step-by-step solutions from verified subject matter experts