

Question: //myopenmaths3.s3.amazonaws.com/cfiles/134330/m_301_test_1_practice.pdf aw V | Read aloud as Ask Copilot 0 -30 -20 89 -10 0 10 20 ximbresiduals + 20 07- 2 of 3
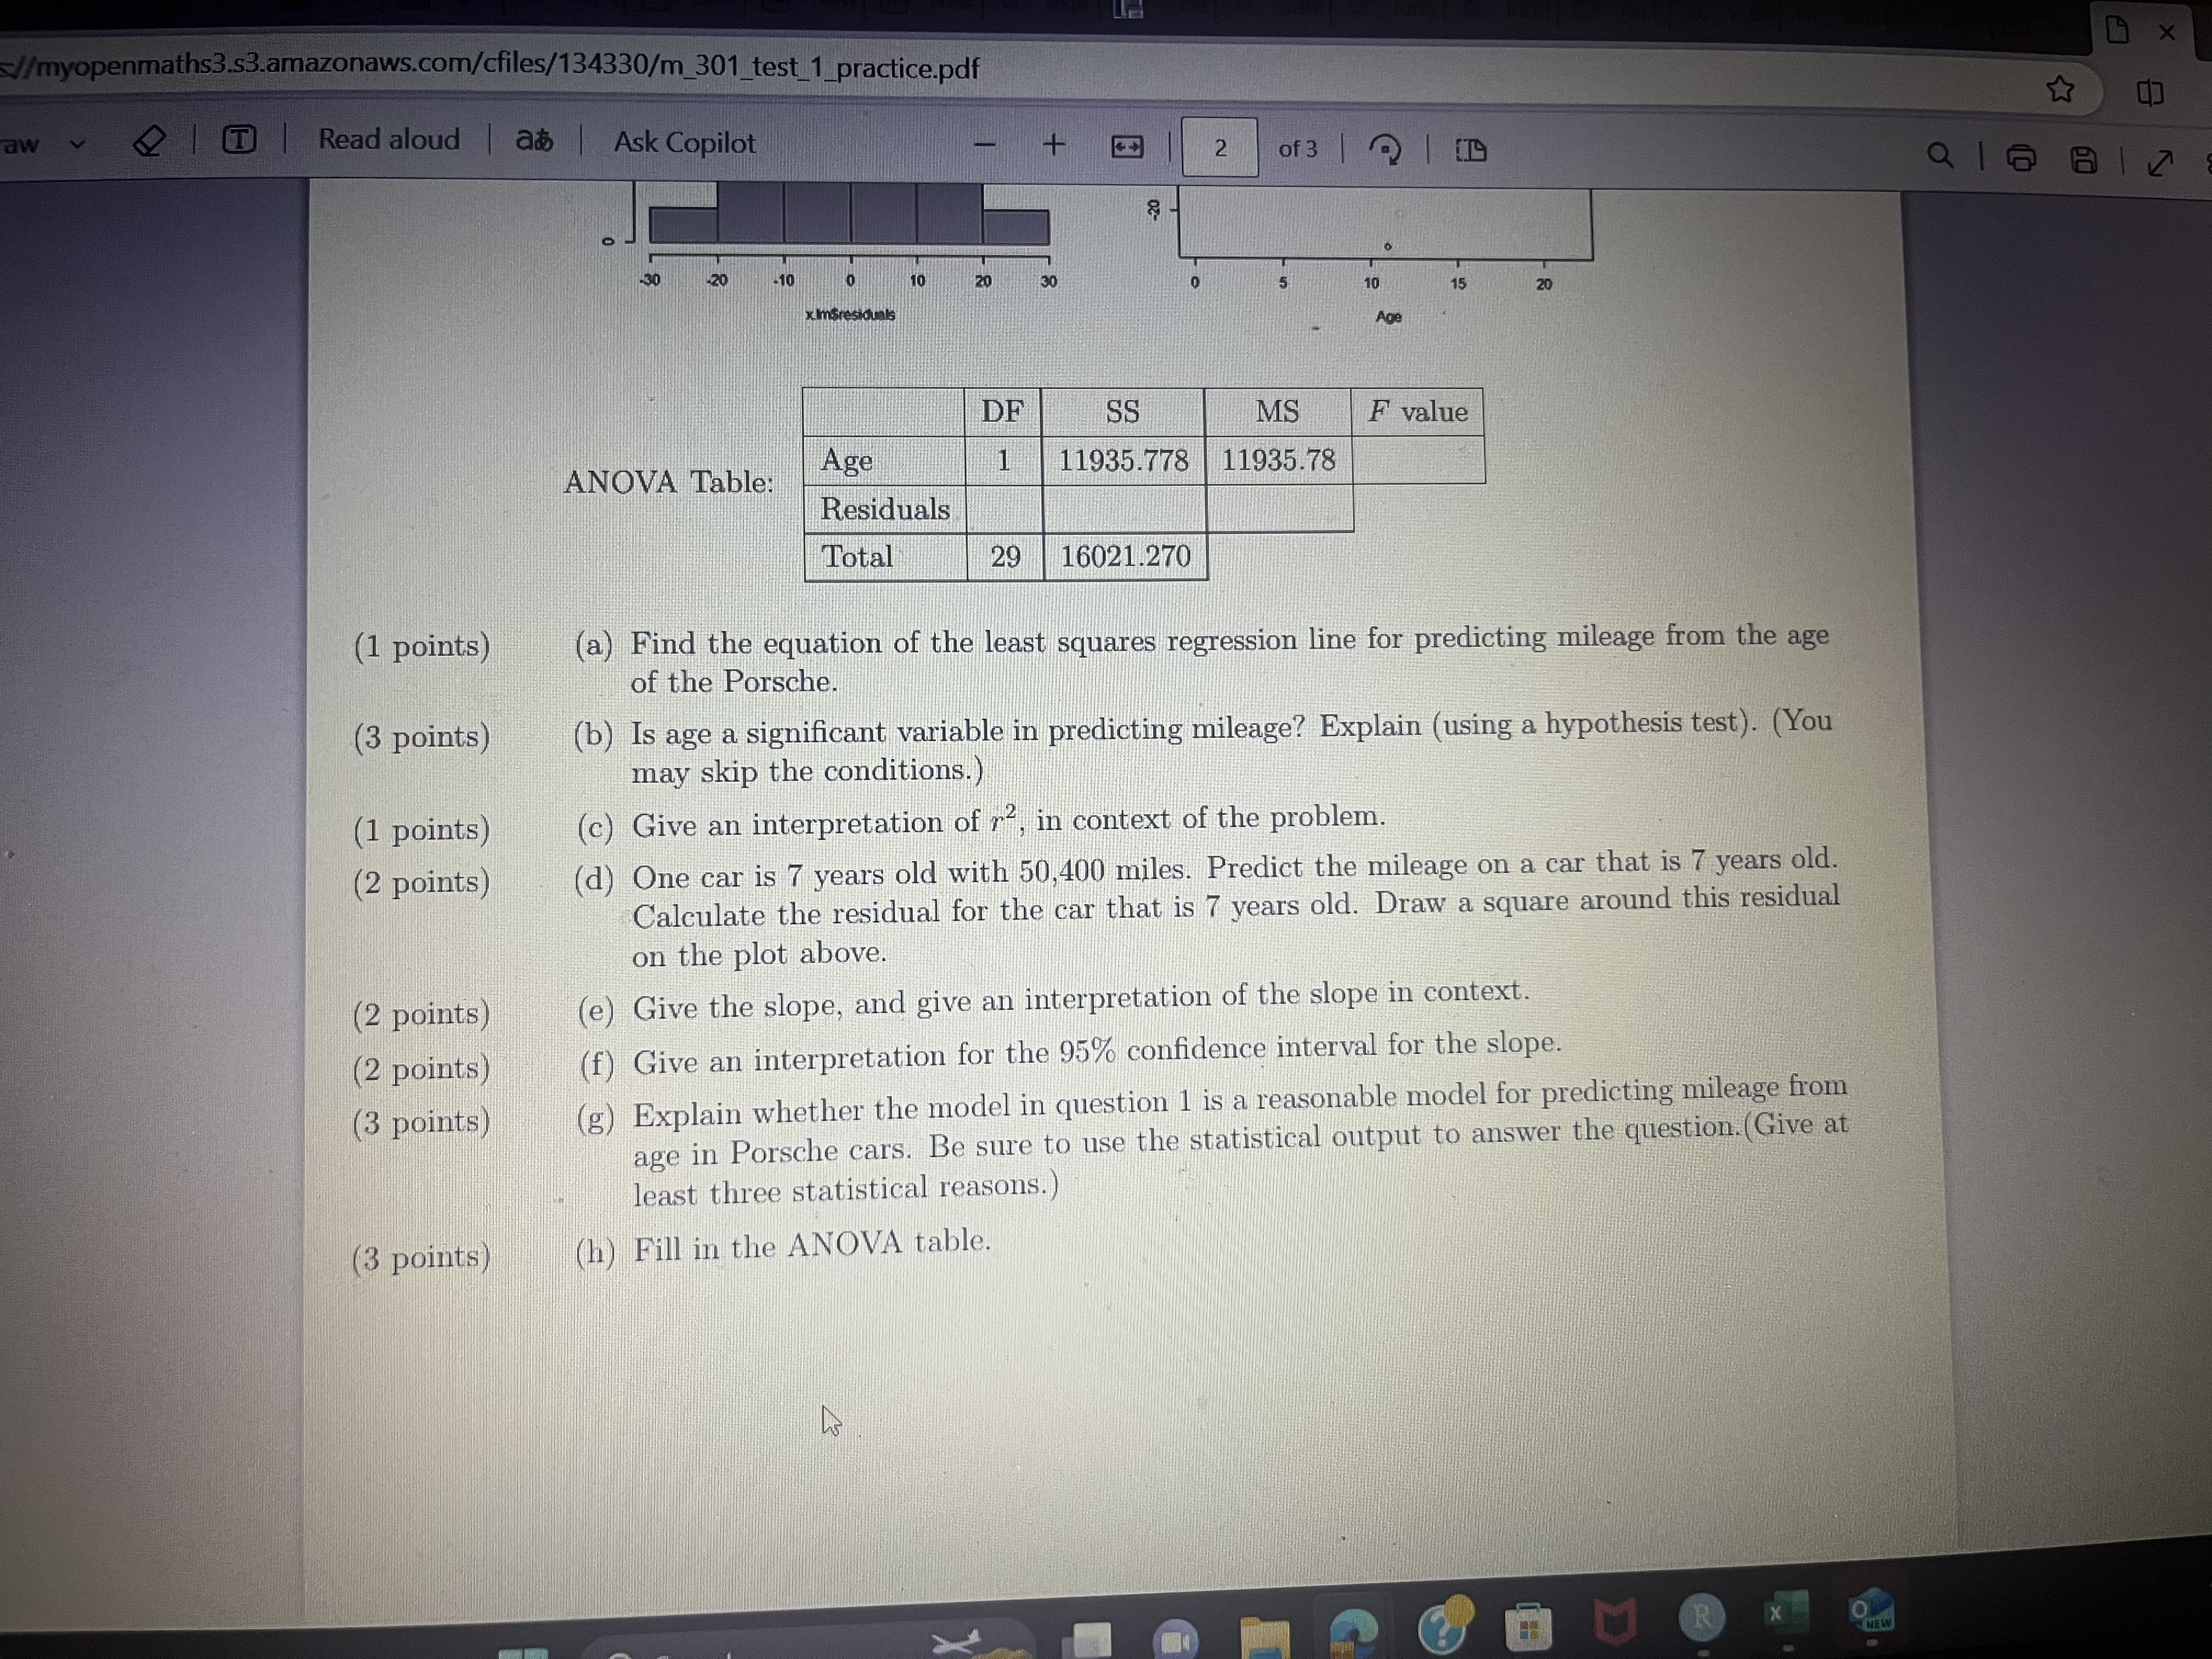

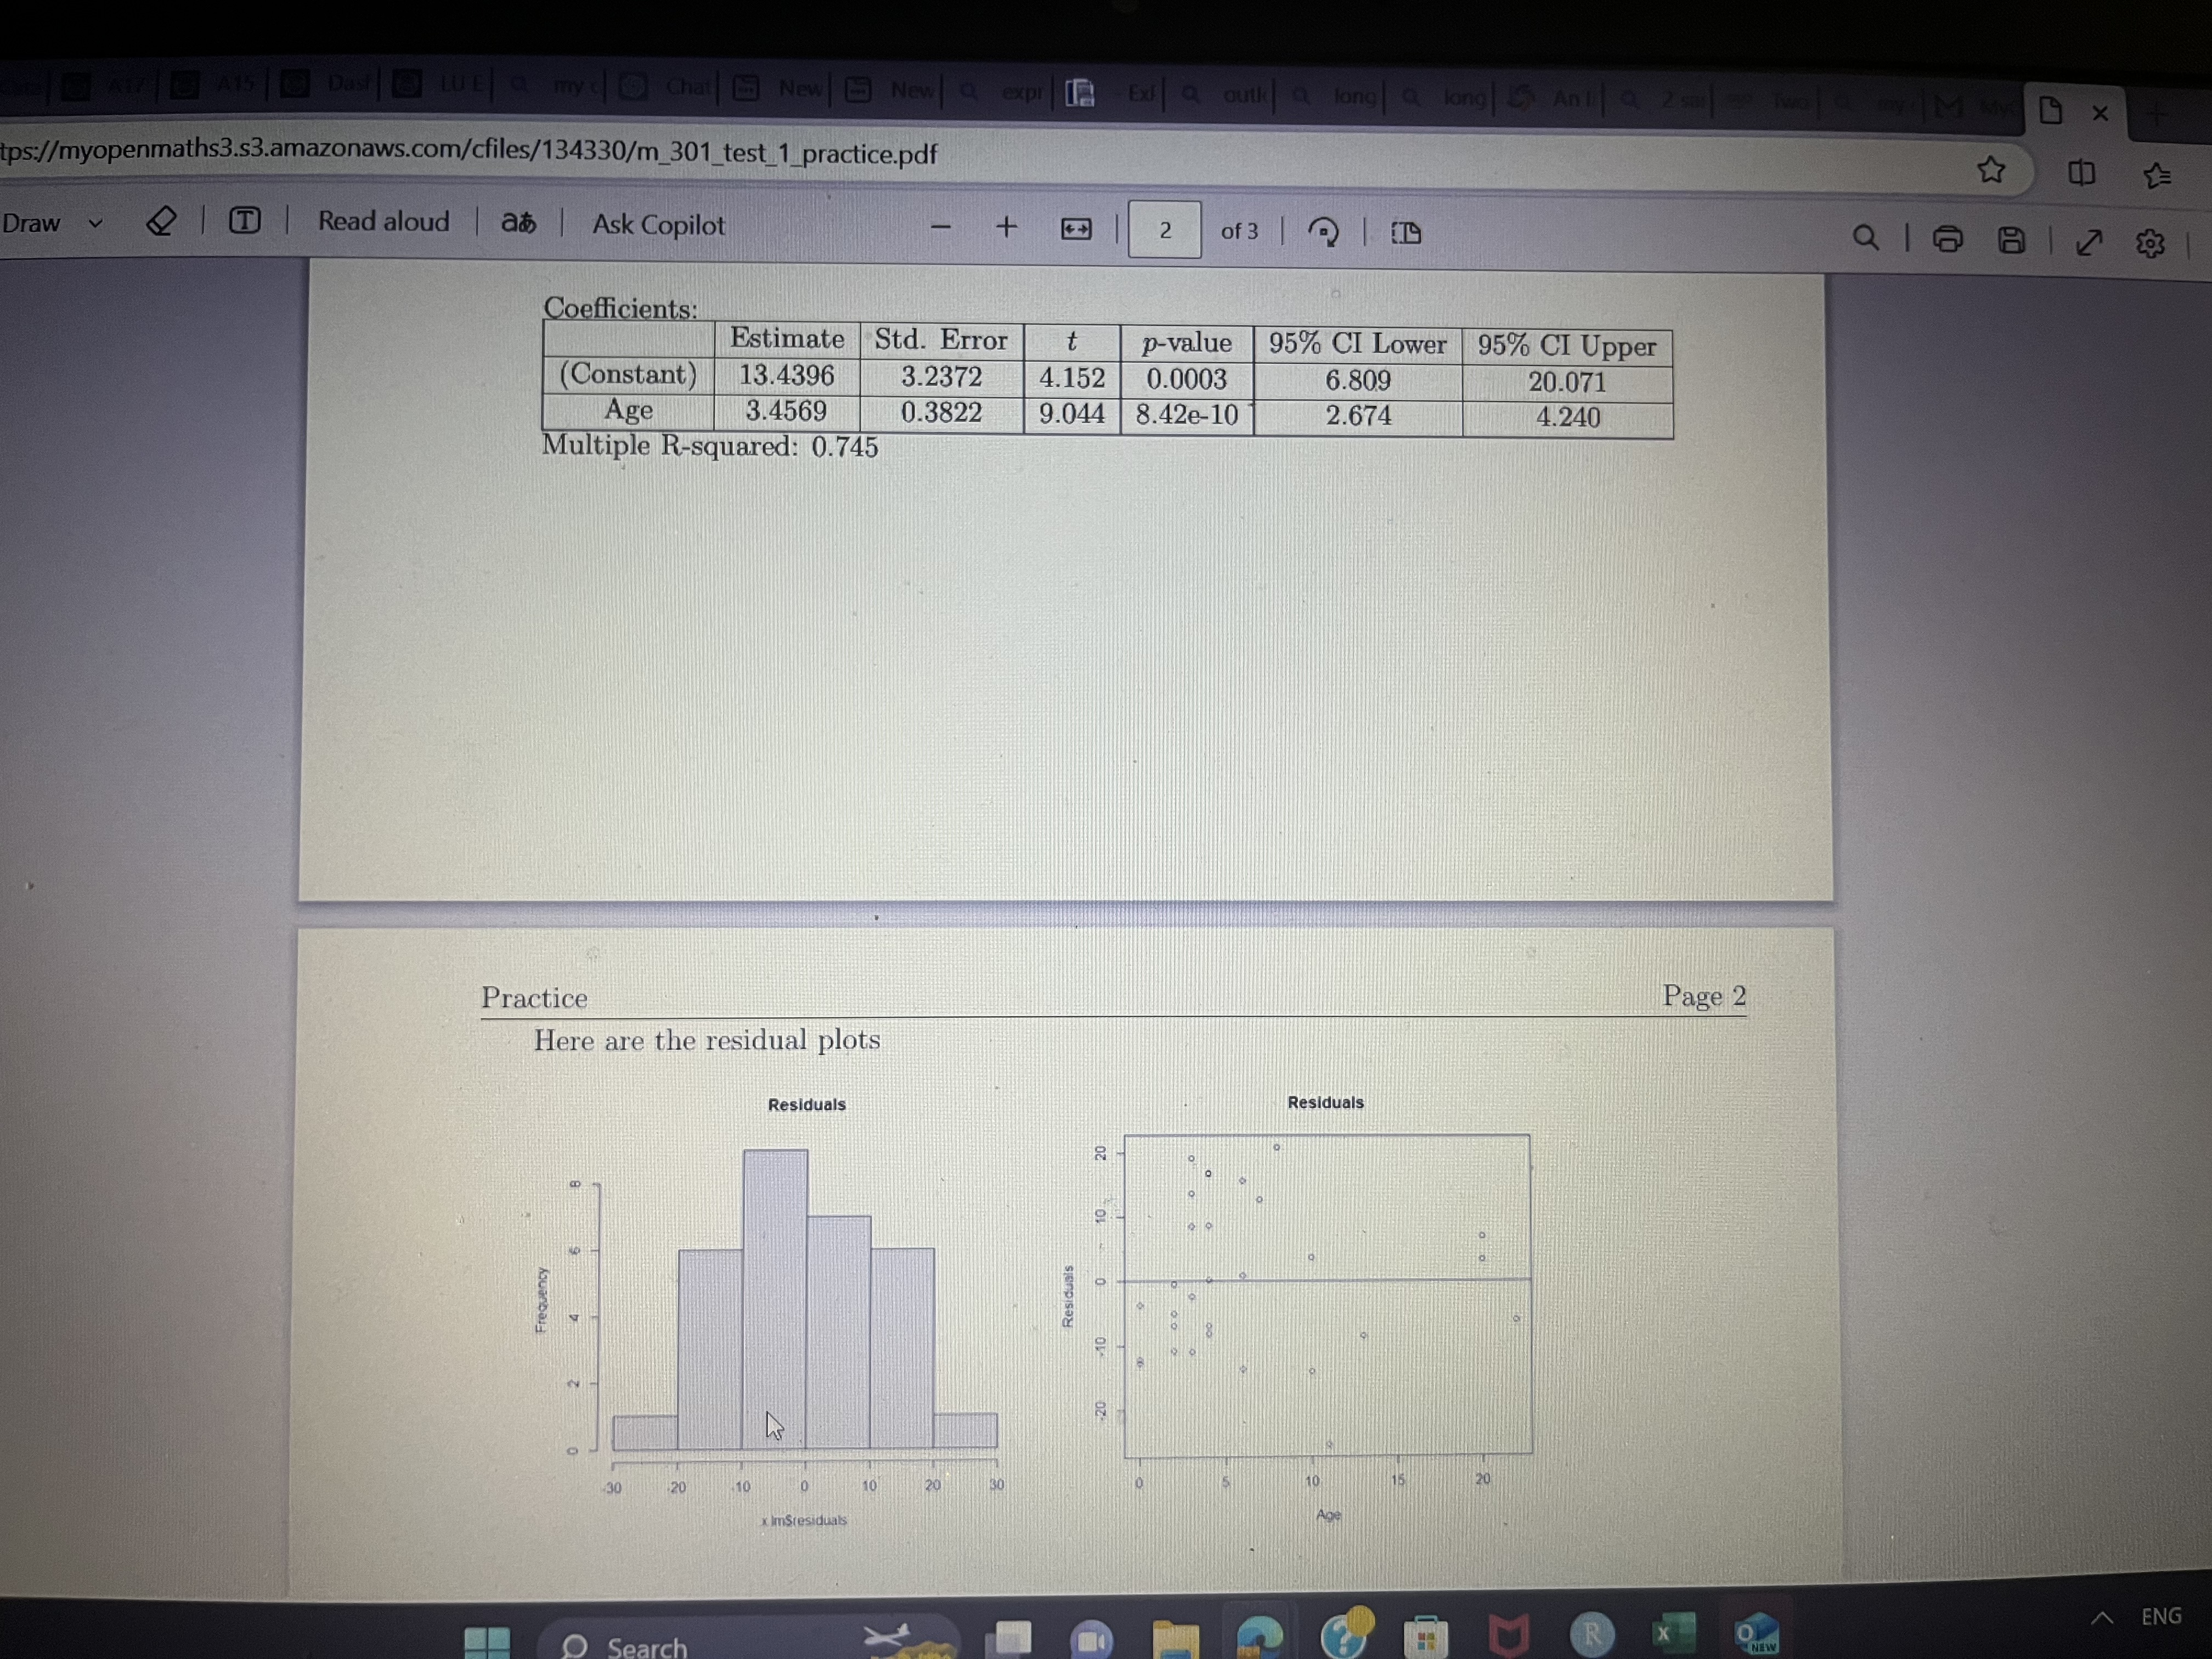
//myopenmaths3.s3.amazonaws.com/cfiles/134330/m_301_test_1_practice.pdf aw V | Read aloud as Ask Copilot 0 -30 -20 89 -10 0 10 20 ximbresiduals + 20 07- 2 of 3 D 30 30 10 5 10 15 20 Age DF SS MS F value Age 1 11935.778 11935.78 ANOVA Table: Residuals Total 29 16021.270 (1 points) (3 points) (1 points) (2 points) (a) Find the equation of the least squares regression line for predicting mileage from the age of the Porsche. (b) Is age a significant variable in predicting mileage? Explain (using a hypothesis test). (You may skip the conditions.) (c) Give an interpretation of r, in context of the problem. (d) One car is 7 years old with 50,400 miles. Predict the mileage on a car that is 7 years old. Calculate the residual for the car that is 7 years old. Draw a square around this residual on the plot above. (e) Give the slope, and give an interpretation of the slope in context. (2 points) (2 points) (f) Give an interpretation for the 95% confidence interval for the slope. (3 points) (g) Explain whether the model in question 1 is a reasonable model for predicting mileage from age in Porsche cars. Be sure to use the statistical output to answer the question. (Give at least three statistical reasons.) (3 points) (h) Fill in the ANOVA table. 610 A X R X NEW + 1 of 3 D X CD Q @ @ Z MATH 301 Practice Name: Directions: Show all work. Answers with no work will not receive full credit. Be neat. Give answers in context, including units when appropriate. 1. We are interested in whether there is a relationship between the age of a car and the mileage of Porsche cars. We take a sample of 30 Porsche cars. The Age is given in years and the Mileage is given in thousands of miles. The data is stored in R as porsche.data. The first few rows is given by: head (porsche.data) https://myopenmaths3.s3.amazonaws.com/cfiles/134330/m_301_test_1_practice.pdf Draw Read aloud | a | Ask Copilot Price Age Mileage 123 69.4 3 21.5 2 56.9 3 43.0 49.9 4 47.4 5 42.9 6 36.9 2446 19.9 36.0 44.0 49.8 Here is the scatterplot, with the regression line added. 09 09 Searcy Mileage vs. Age in Porsches 20 40 0 0 A 0 0 10 15 20 20 X R X NEW A1 A15 Dast LUE a my Chat O New New a New expr expr Exa outk a long a long An 9 2 Two my My X tps://myopenmaths3.s3.amazonaws.com/cfiles/134330/m_301_test_1_practice.pdf Draw Read aloud | a | Ask Copilot - + 2 of 3 D Coefficients: Estimate Std. Error t p-value 95% CI Lower 95% CI Upper (Constant) Age 13.4396 3.2372 3.4569 0.3822 4.152 0.0003 9.044 8.42e-10 6.809 20.071 2.674 4.240 Multiple R-squared: 0.745 Practice Here are the residual plots Frequency 2 4 0 90 30 a 20 20 Search Residuals 20 20 10 10 Residuals 0 07- 20 o Residuals Q 10 10 0 10 20 30 10 5 10 15 20 x Im$residuals R Page 2 NEW < ENG
Step by Step Solution
There are 3 Steps involved in it

Get step-by-step solutions from verified subject matter experts