

Question: Myy SIC Part 2: Data Analysis Open a new tab in your Excel document (the plus sign at the bottom near Sheet 1). You will
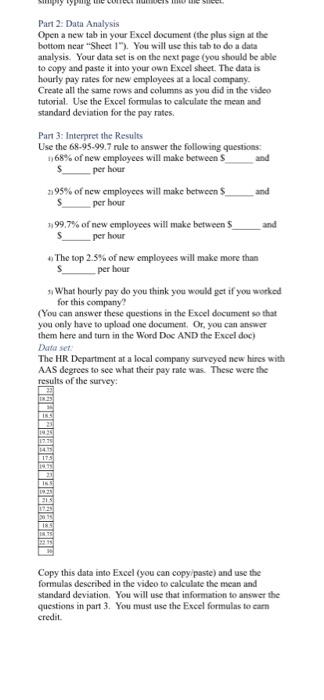
Myy SIC Part 2: Data Analysis Open a new tab in your Excel document (the plus sign at the bottom near Sheet 1"). You will use this tab to do a data analysis. Your data set is on the next page (you should be able to copy and paste it into your own Excel sheet. The data is hourly pay rates for new employees at a local company. Create all the same rows and columns as you did in the video tutorial. Use the Excel formulas to calculate the mean and standard deviation for the pay rates. Part 3: Interpret the Results Use the 68-95-99.7 rule to answer the following questions 1,68% of new employees will make between $ per hour 195% of new employees will make between and per hour 99.7% of new employees will make between $_ and per hour The top 2.5% of new employees will make more than per hour What hourly pay do you think you would get if you worked for this company? (You can answer these questions in the Excel document to that you only have to upload one document, Or, you can answer them here and turn in the Word Doc AND the Excel doc) Data sel The HR Department at a local company surveyed new hires with AAS degrees to see what their pay rate was. These were the results of the survey Copy this data into Excel (you can copy paste) and use the formulas described in the video to calculate the mean and standard deviation. You will use that information to answer the questions in part 3. You must use the Excel formulas to cam credit
Step by Step Solution
There are 3 Steps involved in it

Get step-by-step solutions from verified subject matter experts