

Question: n Enter UCL, CL and LCL to create control chart and then enter data below into the control chart. Show your conclusion for each
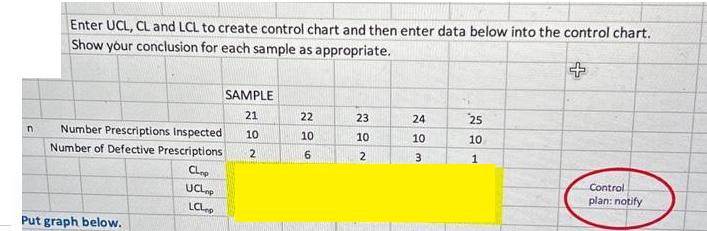
n Enter UCL, CL and LCL to create control chart and then enter data below into the control chart. Show your conclusion for each sample as appropriate. Number Prescriptions Inspected Number of Defective Prescriptions Put graph below. CLep UCLop LCL SAMPLE 21 10 2 Mummon N 22 . 10 23 10 2 24 10 3 25 10 1 + Control plan: notify
Step by Step Solution
There are 3 Steps involved in it
1 Expert Approved Answer
Step: 1 Unlock

Question Has Been Solved by an Expert!
Get step-by-step solutions from verified subject matter experts
Step: 2 Unlock
Step: 3 Unlock