

Question: n the probability distribution to the right the random variable X represents the number of marriages an individual aged 15 years or older has been
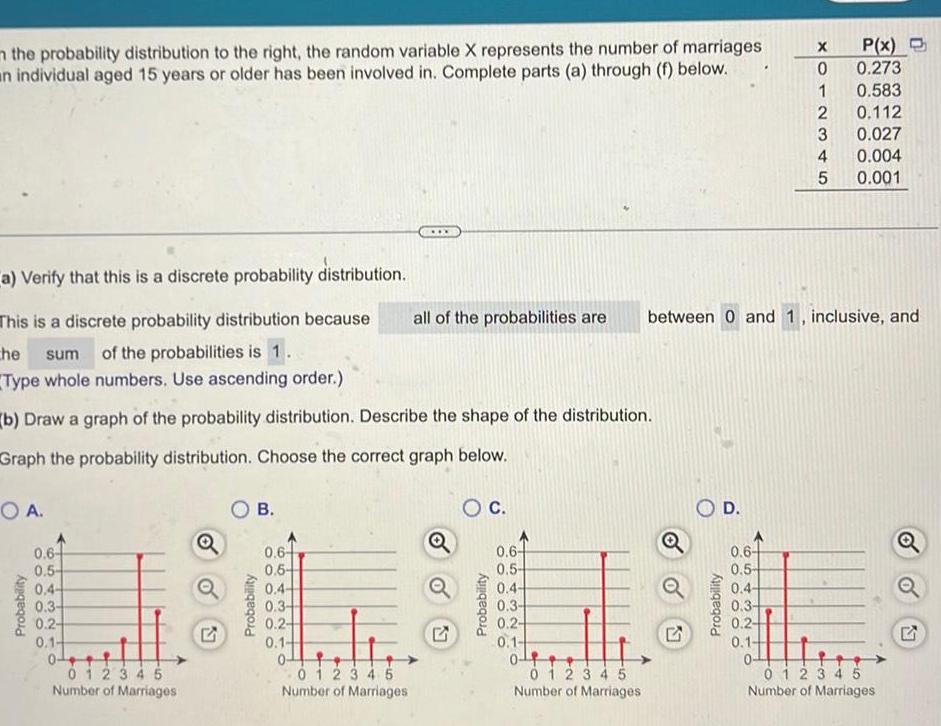

n the probability distribution to the right the random variable X represents the number of marriages an individual aged 15 years or older has been involved in Complete parts a through f below a Verify that this is a discrete probability distribution This is a discrete probability distribution because he sum of the probabilities is 1 Type whole numbers Use ascending order b Draw a graph of the probability distribution Describe the shape of the distribution Graph the probability distribution Choose the correct graph below OA Probability 0 6 0 5 0 4 0 3 0 2 0 1 0 012345 Number of Marriages Q Q OB Probability 0 6 0 5 0 4 0 3 0 2 0 1 01 X 0 1 2 3 4 5 Number of Marriages Q 2 all of the probabilities are between 0 and 1 inclusive and O C Probability 0 6 0 5 0 4 0 3 0 24 0 1 0 0 1 2 3 4 5 Number of Marriages Q Probability D 0 6 0 5 P x 0 273 0 4 0 3 0 2 0 1 0 1 2 3 0 004 4 5 0 001 0 583 0 112 0 027 04 0 1 2 3 4 5 Number of Marriages Q 27
Step by Step Solution
There are 3 Steps involved in it

Get step-by-step solutions from verified subject matter experts