

Question: Question 6 Question Help In the probability distribution to the right, the random variable X represents the number of marriages an individual aged 15 years
Question 6
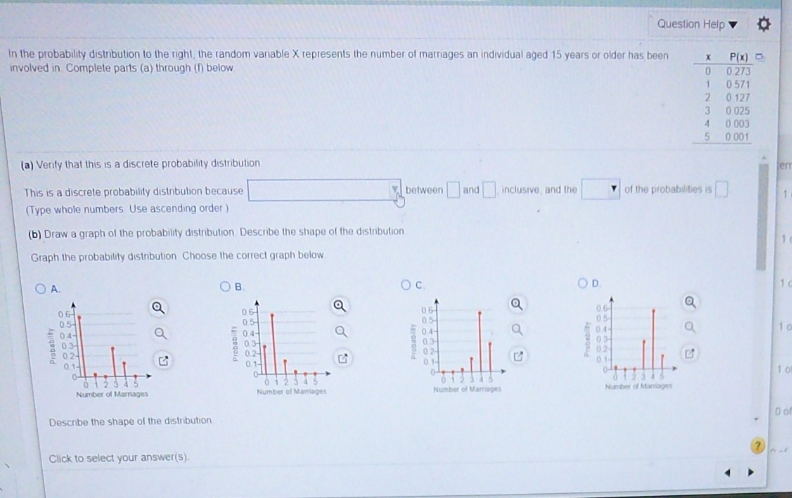
Question Help In the probability distribution to the right, the random variable X represents the number of marriages an individual aged 15 years or older has been P(x) involved in Complete parts (a) through (f) below 0 0.273 1 0 571 2 0 127 3 0 025 4 0 003 0 001 (a) Venty that this is a discrete probability distribution This is a discrete probability distribution because between and , inclusive, and the of the probabilities is (Type whole numbers. Use ascending order ) (b) Draw a graph of the probability distribution Describe the shape of the distribution Graph the probability distribution Choose the correct graph below OA OB OC OD DG a a 06- 06 0.5- 05 0.5- a a D4- Q Probably 0.3 03 0.3 Probeb 02- 02- 02- 0.1- 014 612345 Number of Marriages Number of Marriages Number of Marriages Number of Marriages D of Describe the shape of the dieinbution Click to select your answer(s)
Step by Step Solution
There are 3 Steps involved in it

Get step-by-step solutions from verified subject matter experts