

Question: Naive Bayes Fit Details class Training Validation Misclassification Misclassification Count Rate Misclassifications Count Rate Misclassifications 667 0.29985 200 333 0.30030 100 Confusion Matrix Training Validation
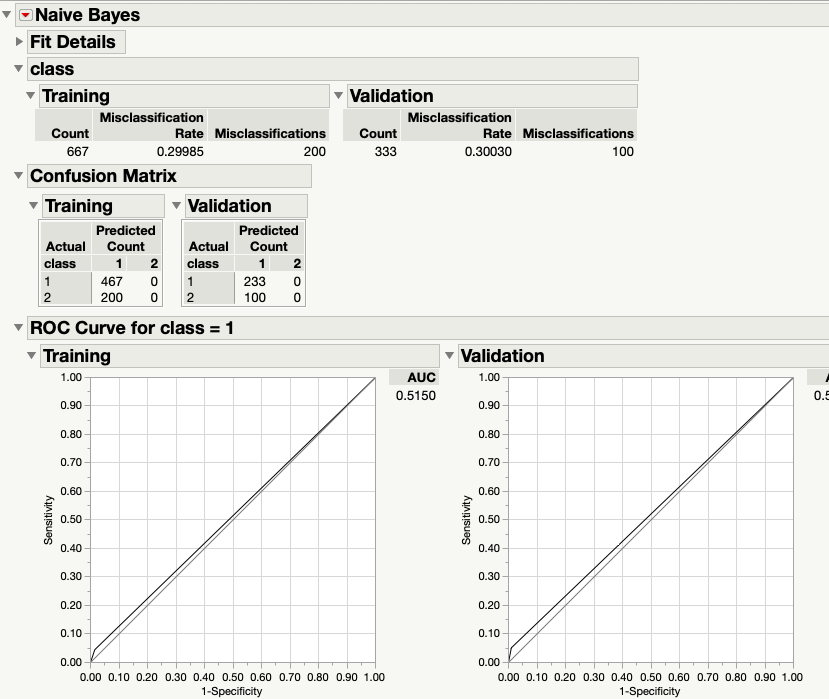
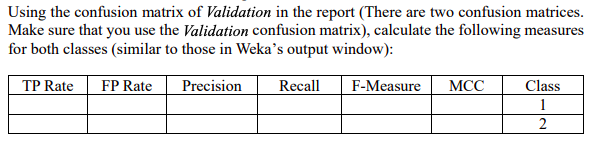
Naive Bayes Fit Details class Training Validation Misclassification Misclassification Count Rate Misclassifications Count Rate Misclassifications 667 0.29985 200 333 0.30030 100 Confusion Matrix Training Validation Predicted Predicted Actual Count Actual Count class class 467 233 O O N 200 100 ROC Curve for class = 1 Training Validation 1.00 AUC 1.00 0.5150 O. 0.90 0.90 0.80 0.80 0.70 0.70 0.60 0.60 0.50 Sensitivity 0.50 Sensitivity 0.40 0.40 0.30 0.30 0.20 0.20 0.10 0.10 0.00 0.00- 0.00 0.10 0.20 0.30 0.40 0.50 0.60 0.70 0.80 0.90 1.00 0.00 0.10 0.20 0.30 0.40 0.50 0.60 0.70 0.80 0.90 1.00 1-Specificity 1-SpecificityUsing the confusion matrix of Validation in the report (There are two confusion matrices. Make sure that you use the Validation confusion matrix), calculate the following measures for both classes (similar to those in Weka's output window): TP Rate FP Rate Precision Recall F-Measure MCC Class 1 2
Step by Step Solution
There are 3 Steps involved in it

Get step-by-step solutions from verified subject matter experts