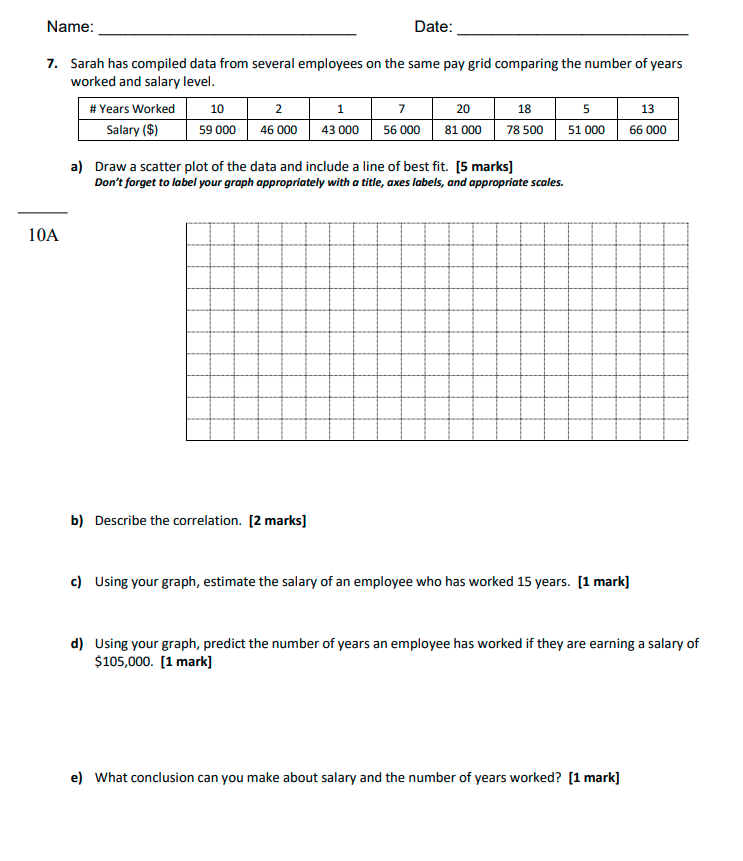
Question: Name: Date: 7. Sarah has compiled data from several employees on the same pay grid comparing the number of years worked and salary level. #

Name: Date: 7. Sarah has compiled data from
Name: Date: 7. Sarah has compiled data from several employees on the same pay grid comparing the number of years worked and salary level. # Years Worked 10 2 1 7 20 18 5 13 Salary ($) 59 000 46 000 43 000 56 000 81 000 78 500 51 000 66 000 a) Draw a scatter plot of the data and include a line of best fit. [5 marks] Don't forget to label your graph appropriately with a title, axes labels, and appropriate scales. 10A b) Describe the correlation. [2 marks] c) Using your graph, estimate the salary of an employee who has worked 15 years. [1 mark] d) Using your graph, predict the number of years an employee has worked if they are earning a salary of $105,000. [1 mark] e) What conclusion can you make about salary and the number of years worked? [1 mark]

Step by Step Solution

There are 3 Steps involved in it

1 Expert Approved Answer
Step: 1 Unlock blur-text-image
Question Has Been Solved by an Expert!

Get step-by-step solutions from verified subject matter experts

Step: 2 Unlock
Step: 3 Unlock

Students Have Also Explored These Related Mathematics Questions!