

Question: Sarah has complied data from several employees on the same pay grid comparing number of years worked and salary level. Years Worked 10 2 1
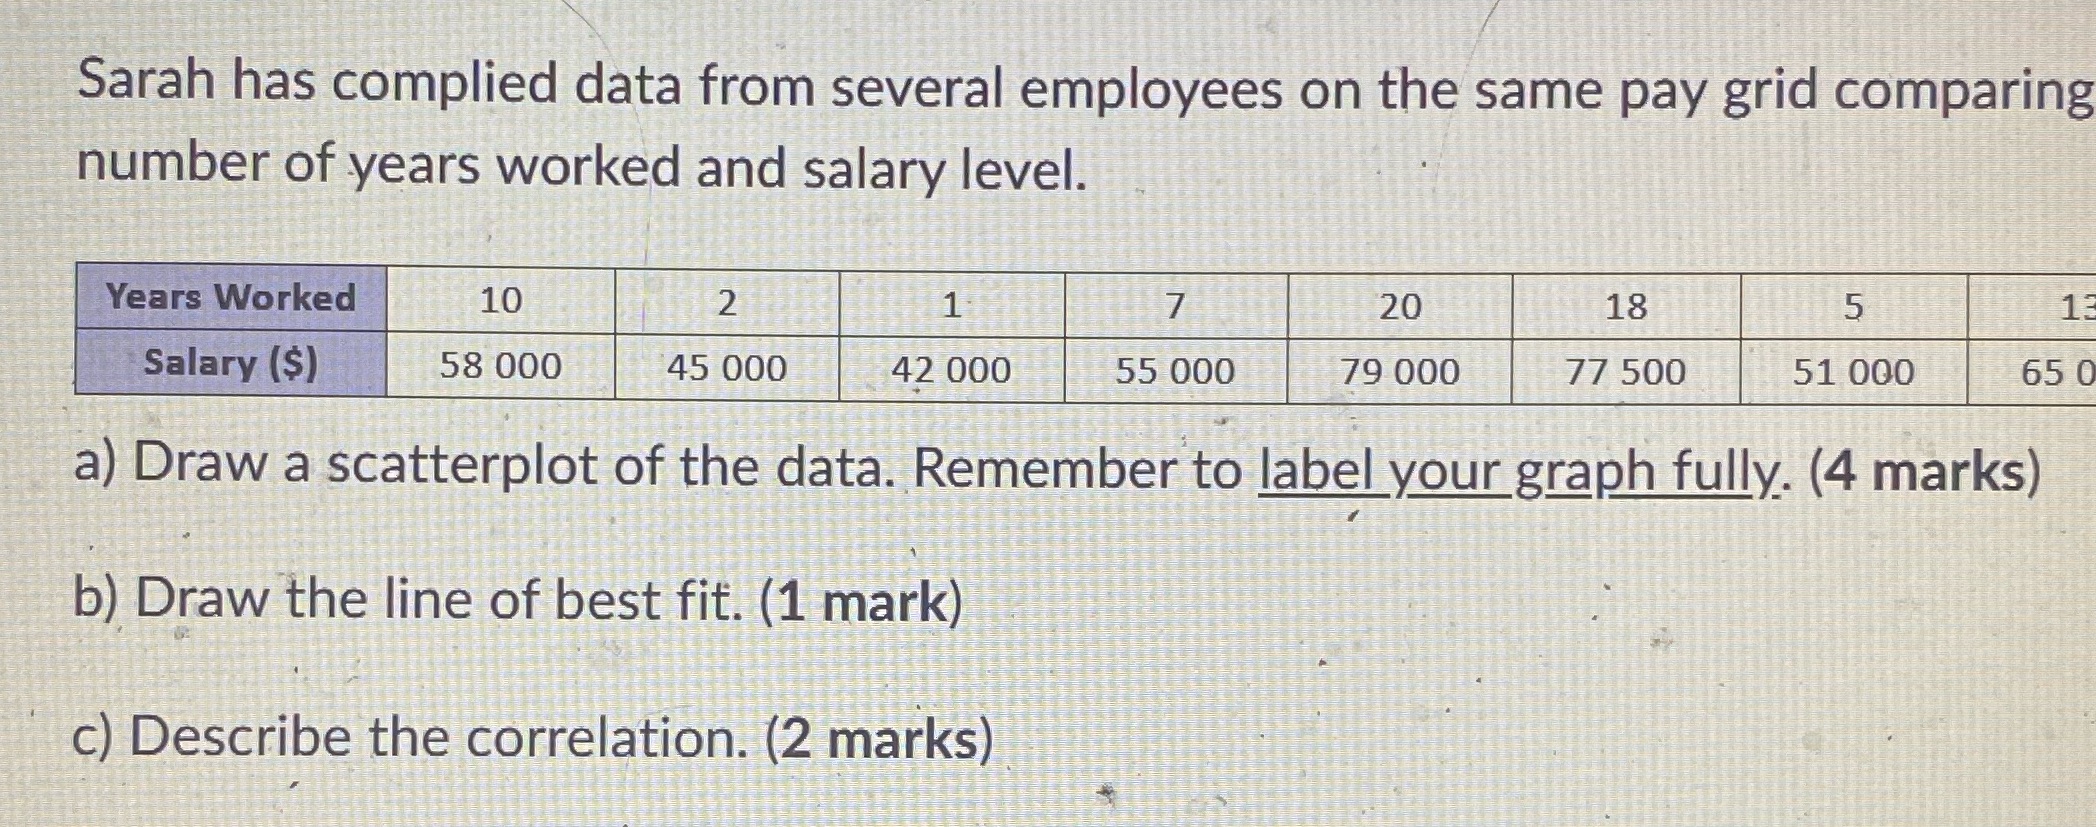
Sarah has complied data from several employees on the same pay grid comparing number of years worked and salary level. Years Worked 10 2 1 7 20 18 5 1: Salary ($) 58 000 45 000 42 000 55 000 79 000 77 500 51 000 65 0 a) Draw a scatterplot of the data. Remember to label your graph fully. (4 marks) b) Draw the line of best fit. (1 mark) c) Describe the correlation. (2 marks)
Step by Step Solution
There are 3 Steps involved in it
1 Expert Approved Answer
Step: 1 Unlock

Question Has Been Solved by an Expert!
Get step-by-step solutions from verified subject matter experts
Step: 2 Unlock
Step: 3 Unlock