

Question: Name Date Class LESSON 11-1 Comparing Data Displayed in Dot Plots Practice and Problem Solving: D Answer the questions for each dot plot. The first
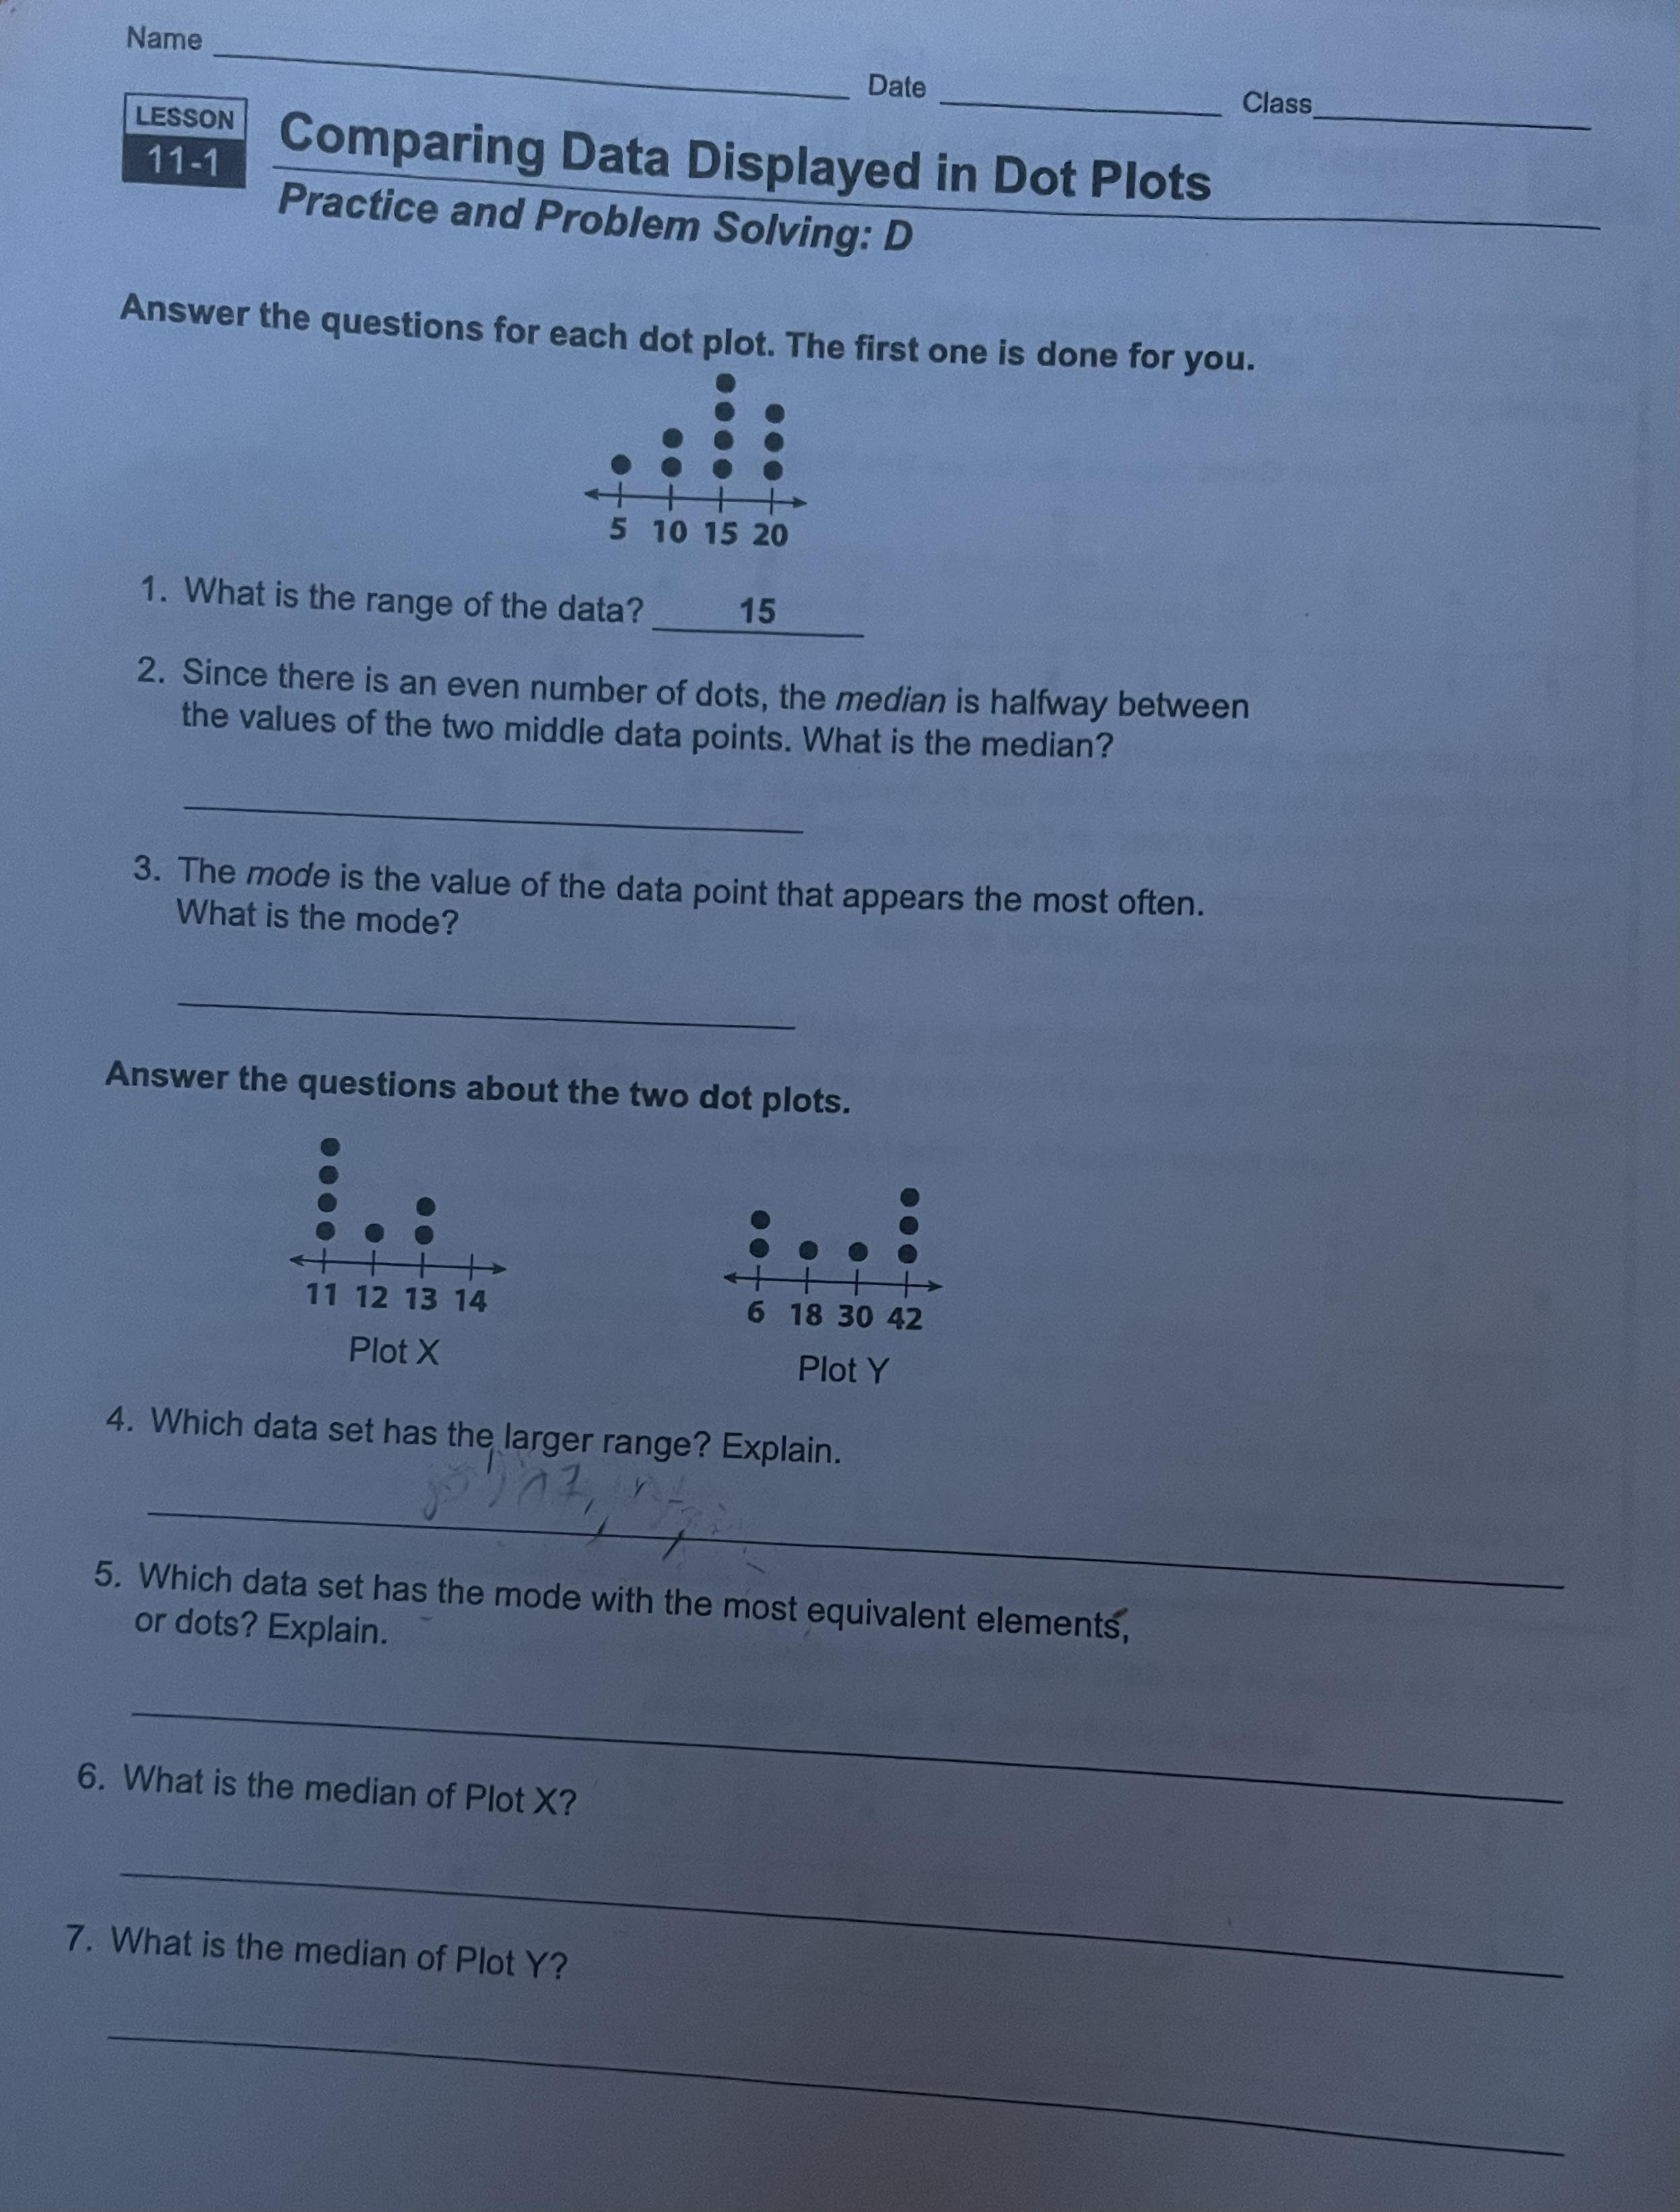
Name Date Class LESSON 11-1 Comparing Data Displayed in Dot Plots Practice and Problem Solving: D Answer the questions for each dot plot. The first one is done for you. 5 10 15 20 1. What is the range of the data? 15 2. Since there is an even number of dots, the median is halfway between the values of the two middle data points. What is the median? 3. The mode is the value of the data point that appears the most often. What is the mode? Answer the questions about the two dot plots. 11 12 13 14 6 18 30 42 Plot X Plot Y 4. Which data set has the larger range? Explain. 5. Which data set has the mode with the most equivalent elements, or dots? Explain. 6. What is the median of Plot X? 7. What is the median of Plot Y
Step by Step Solution
There are 3 Steps involved in it

Get step-by-step solutions from verified subject matter experts