

Question: Class Date Name LESSON Comparing Data Displayed in Dot Plots 11-1 Practice and Problem Solving: C Use the description and dot plots below to complete
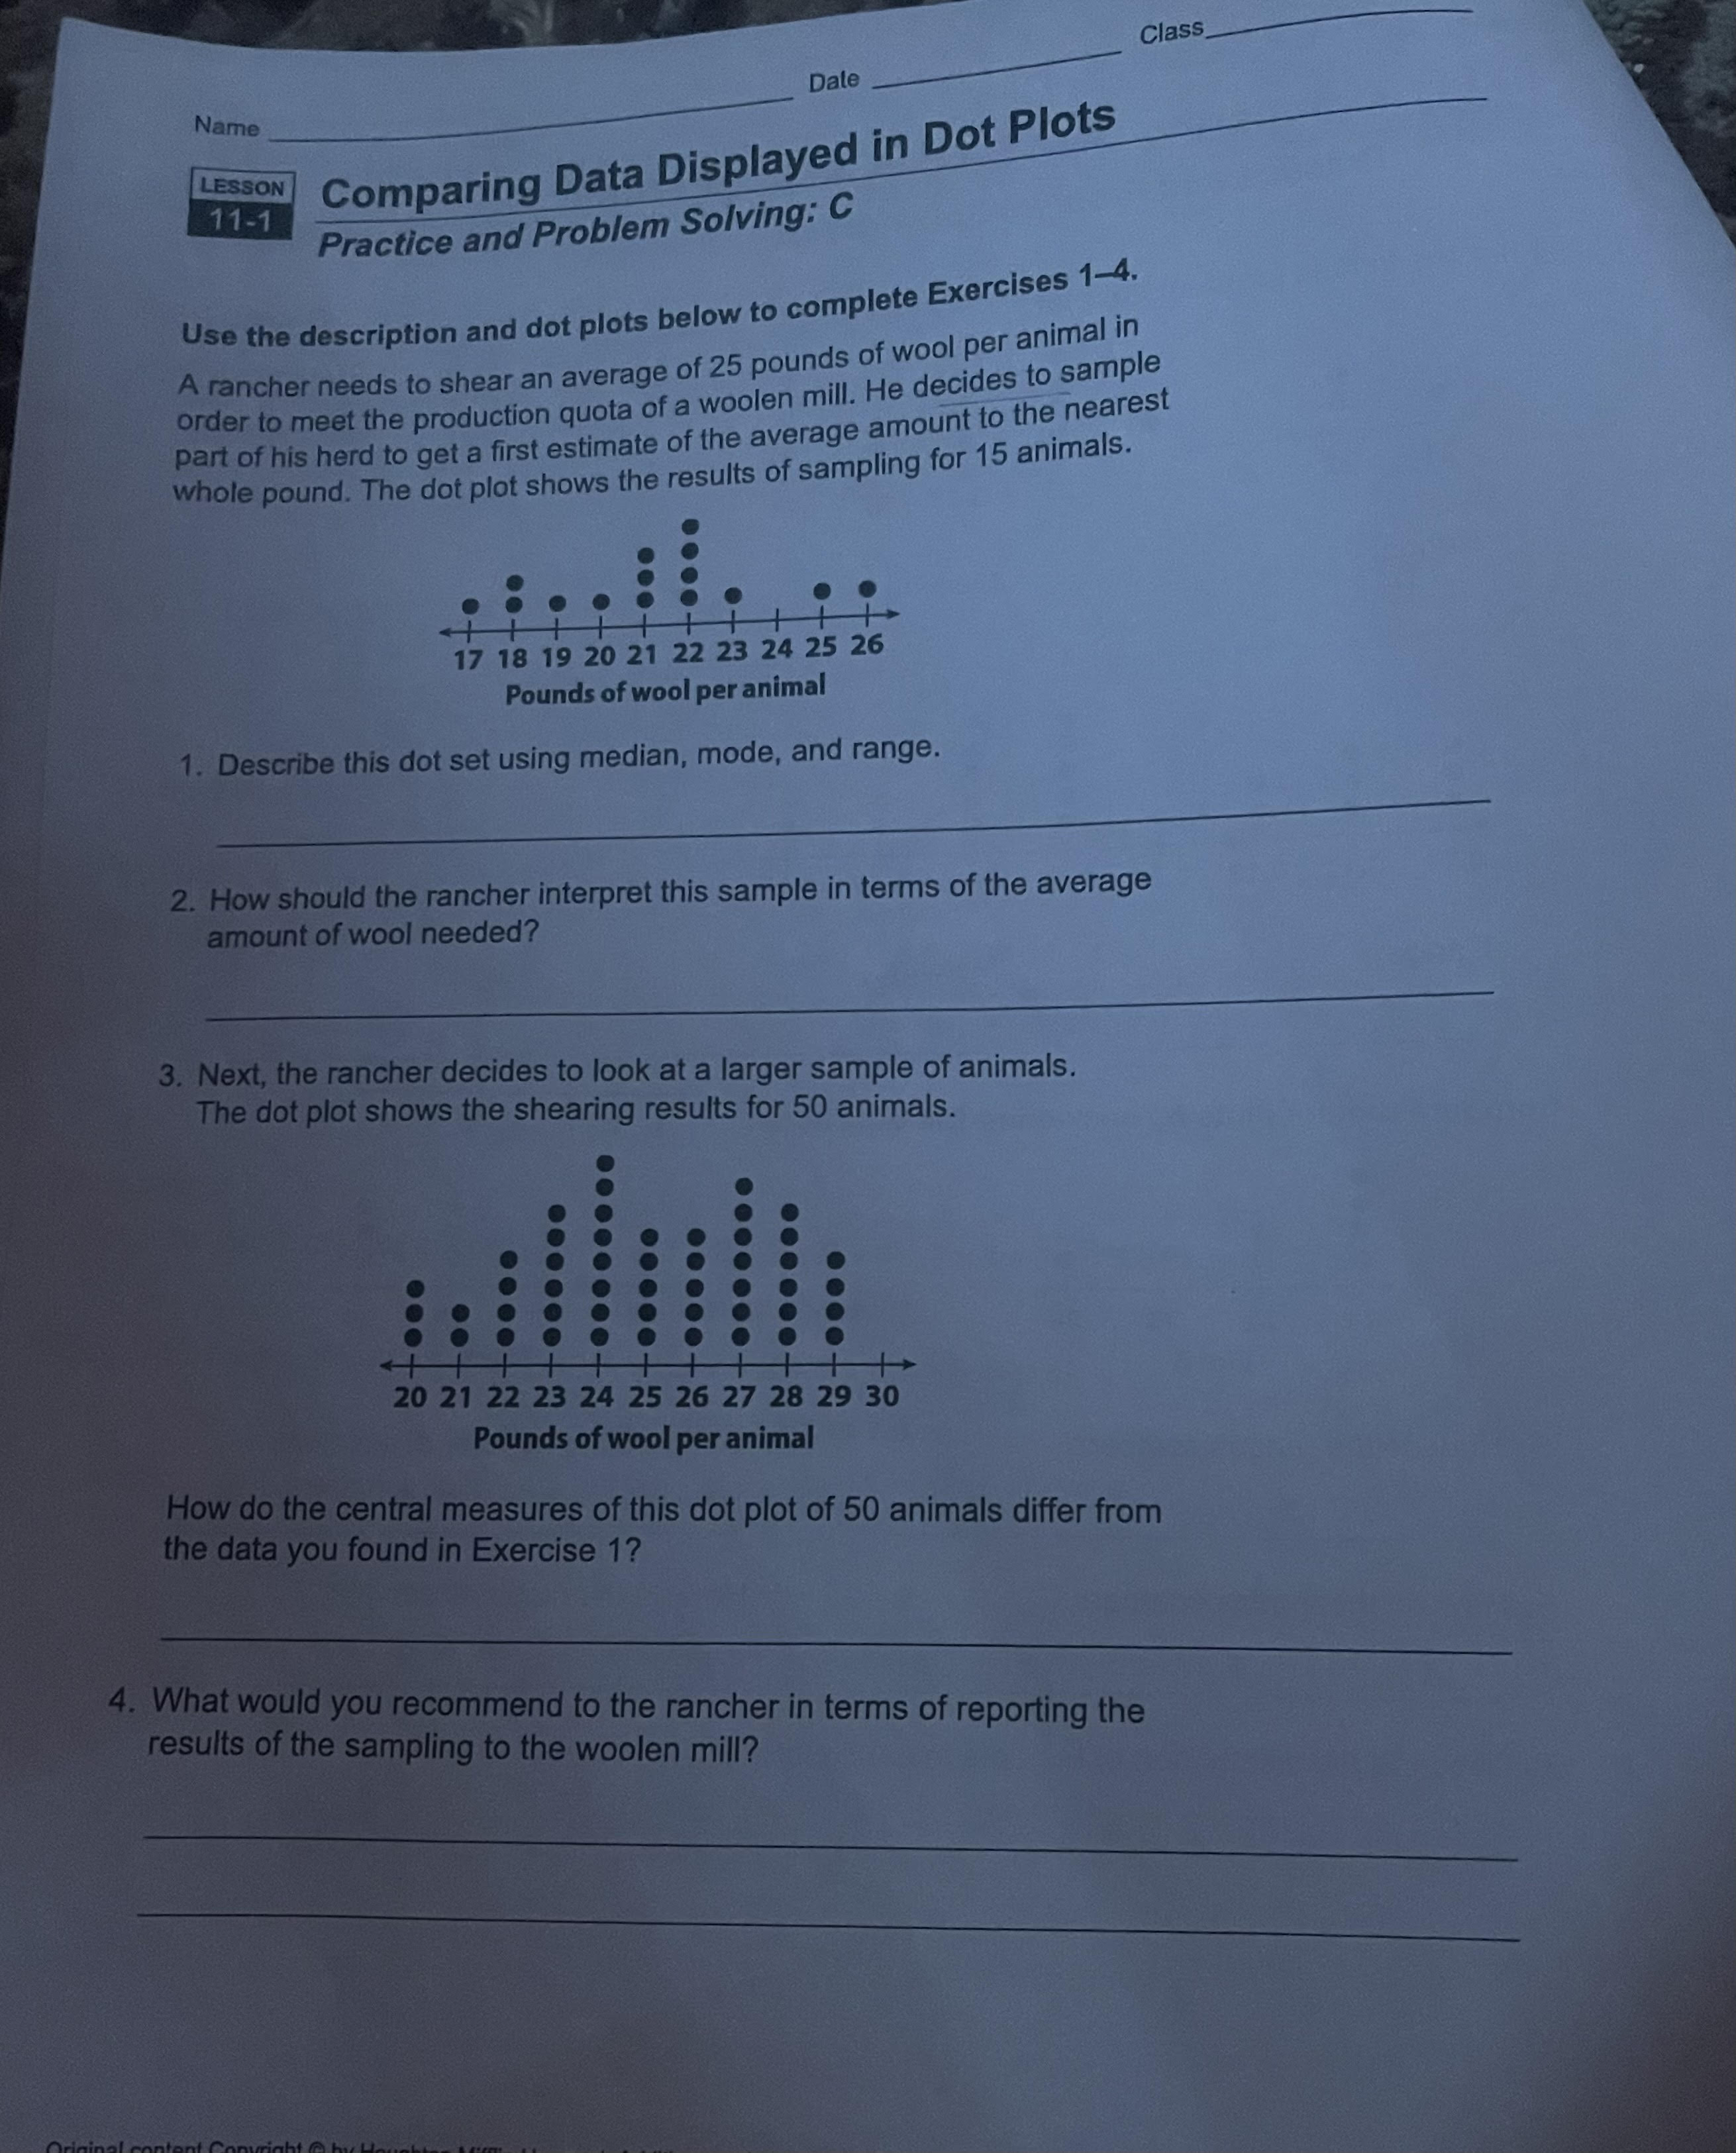
Class Date Name LESSON Comparing Data Displayed in Dot Plots 11-1 Practice and Problem Solving: C Use the description and dot plots below to complete Exercises 1-4. A rancher needs to shear an average of 25 pounds of wool per animal in order to meet the production quota of a woolen mill. He decides to sample part of his herd to get a first estimate of the average amount to the nearest whole pound. The dot plot shows the results of sampling for 15 animals. 17 18 19 20 21 22 23 24 25 26 Pounds of wool per animal 1. Describe this dot set using median, mode, and range. 2. How should the rancher interpret this sample in terms of the average amount of wool needed? 3. Next, the rancher decides to look at a larger sample of animals. The dot plot shows the shearing results for 50 animals. . . . . . . 20 21 22 23 24 25 26 27 28 29 30 Pounds of wool per animal How do the central measures of this dot plot of 50 animals differ from the data you found in Exercise 1? 4. What would you recommend to the rancher in terms of reporting the results of the sampling to the woolen mill
Step by Step Solution
There are 3 Steps involved in it

Get step-by-step solutions from verified subject matter experts