

Question: Name: Date: Gas Laws Simulation Lab . Go to this web site: https://phet.colorado.edufen/simulation/states-of matter-basics 0 Click on the play arrow. 0 Click on the Phase
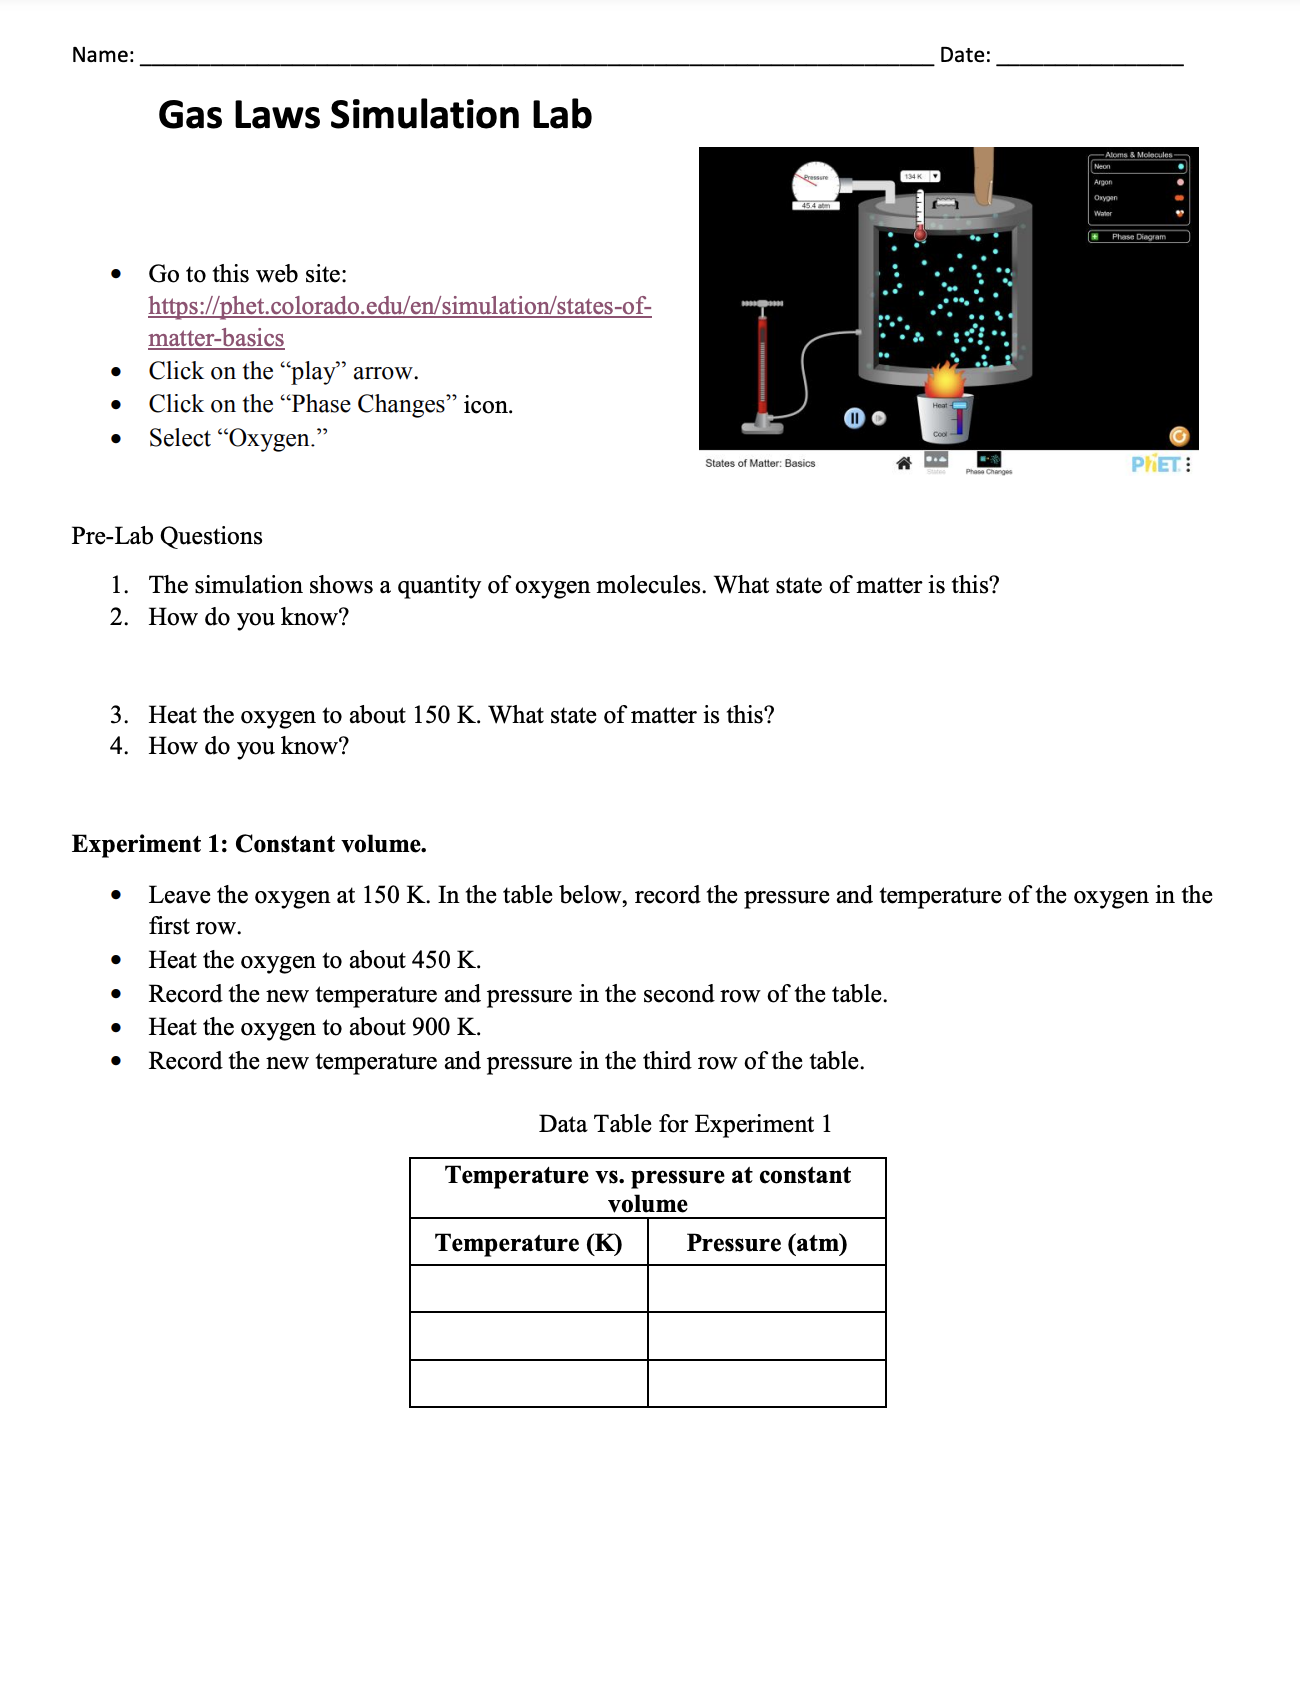
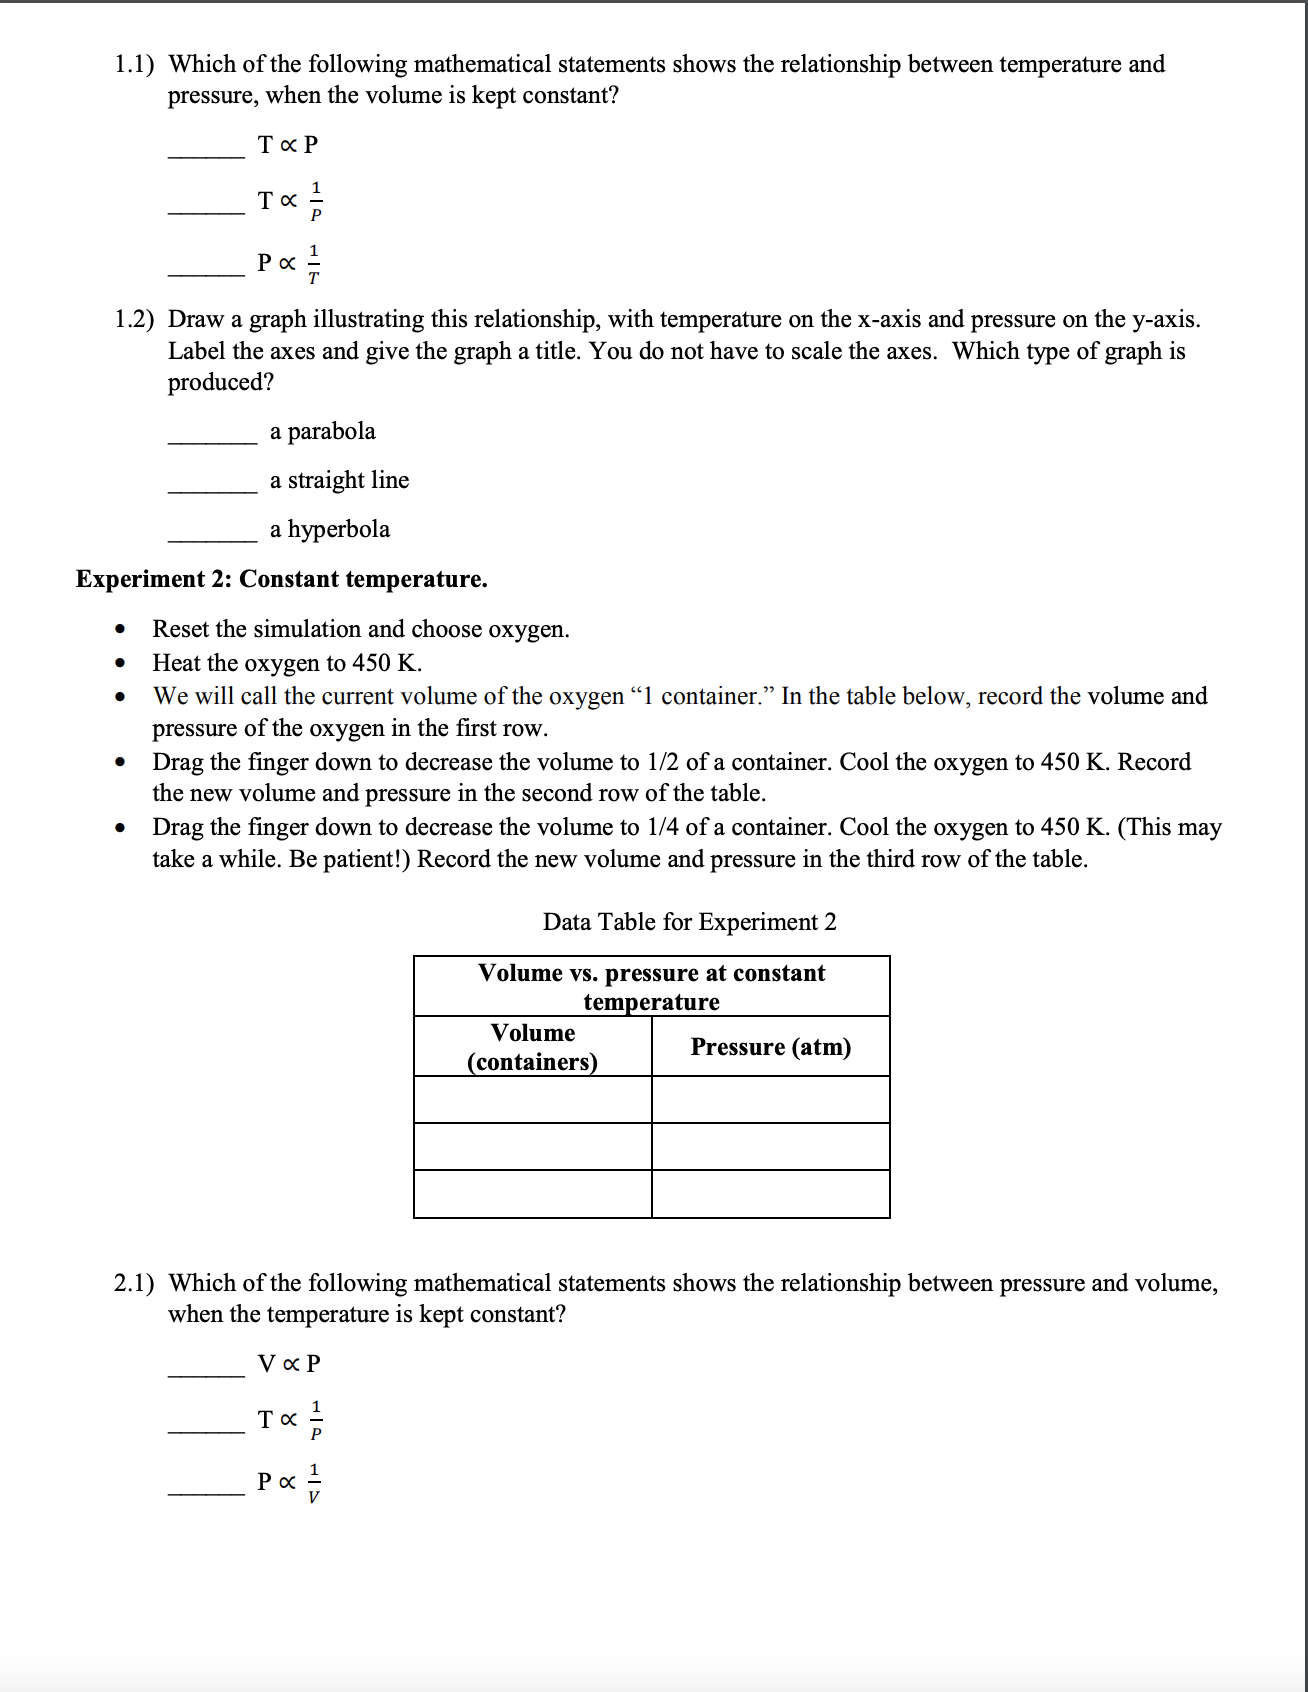


Name: Date: Gas Laws Simulation Lab . Go to this web site: https://phet.colorado.edufen/simulation/states-of matter-basics 0 Click on the \"play\" arrow. 0 Click on the \"Phase Changes\" icon. 0 Select \"Oxygen.\" Status :41 Hum". Beam: i m _. PreLab Questions 1. The simulation shows a quantity of oxygen molecules. What state of matter is this? 2. How do you know? 3. Heat the oxygen to about 150 K. What state of matter is this? 4. How do you know? Experiment 1: Constant volume. 0 Leave the oxygen at 150 K. In the table below, record the pressure and temperature of the oxygen in the rst row. . Heat the oxygen to about 450 K. 0 Record the new temperature and pressure in the second row of the table. 0 Heat the oxygen to about 900 K. G Record the new temperature and pressure in the third row of the table. Data Table for Experiment 1 Temperature vs. pressure at constant 1.1) Which of the following mathematical statements shows the relationship between temperature and pressure, when the volume is kept constant? TOCP To:l P Poci T 1.2) Draw a graph illustrating this relationship, with temperature on the xaxis and pressure on the y-axis. Label the axes and give the graph 3 title. You do not have to scale the axes. Which type of graph is produced? a parabola a straight line a hyperbola Experiment 2: Constant temperature. 0 Reset the simulation and choose oxygen. . Heat the oxygen to 450 K. I We will call the current volume of the oxygen \"1 container.\" 1n the table below, record the volume and pressure of the oxygen in the rst row. | Drag the nger down to decrease the volume to 1/2 of a container. Cool the oxygen to 450 K. Record the new volume and pressure in the second row of the table. 0 Drag the nger down to decrease the volume to 1/4 of a container. Cool the oxygen to 450 K. (This may take a while. Be patient!) Record the new volume and pressure in the third row of the table. Data Table for Experiment 2 Volume vs. pressure at constant tern I erature Volume . Pressure (atm) containers 2.1) Which of the following mathematical statements shows the relationship between pressure and volume, when the temperature is kept constant? V0
Step by Step Solution
There are 3 Steps involved in it

Get step-by-step solutions from verified subject matter experts