

Question: Name: Summarize your year - to - year financial analysis results in a table. Illustrate the change in financial information over time using graphs (
Name:
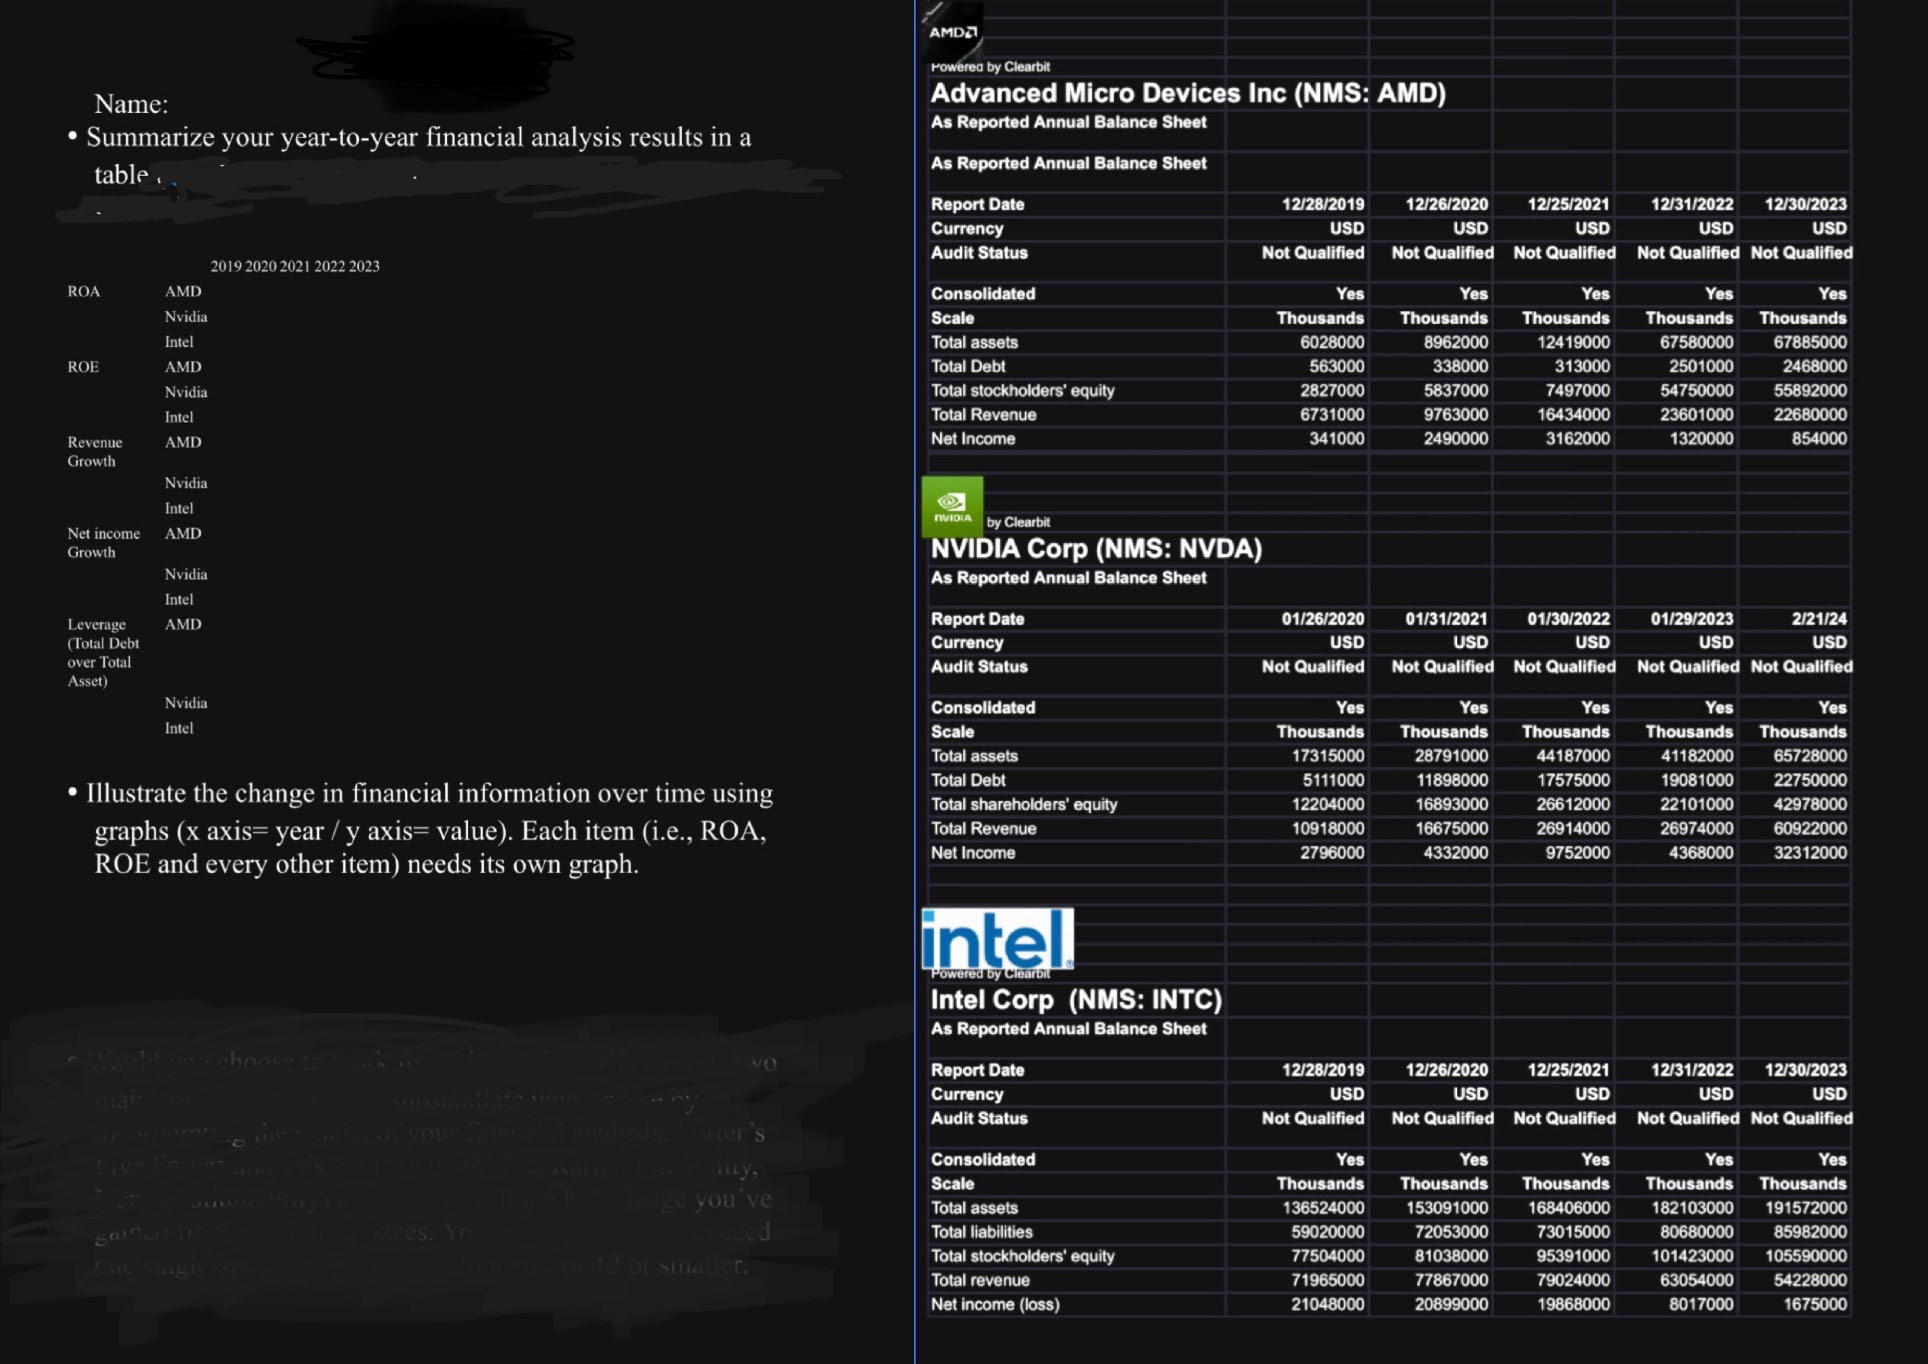
Summarize your yeartoyear financial analysis results in a
table.
Illustrate the change in financial information over time using
graphs x axis year y axis value Each item ie ROA,
ROE and every other item needs its own graph.
Step by Step Solution
There are 3 Steps involved in it
1 Expert Approved Answer
Step: 1 Unlock

Question Has Been Solved by an Expert!
Get step-by-step solutions from verified subject matter experts
Step: 2 Unlock
Step: 3 Unlock