

Question: Name the skew of each graph below, explain your answer. Histogram Class: Underclassmen Mean = std Dev 10 sleep = 2 204

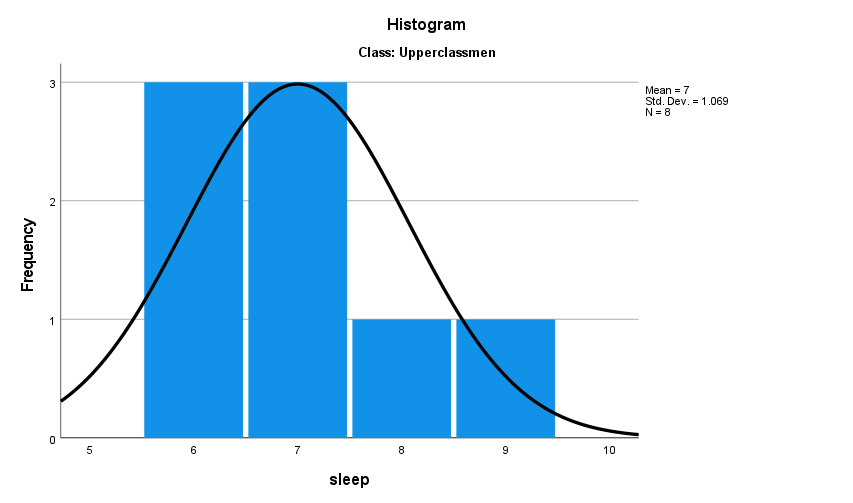

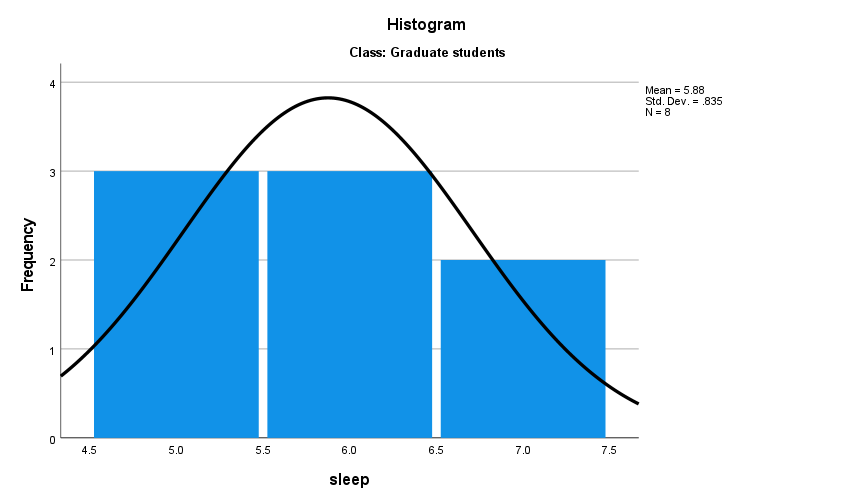
Name the skew of each graph below, explain your answer.
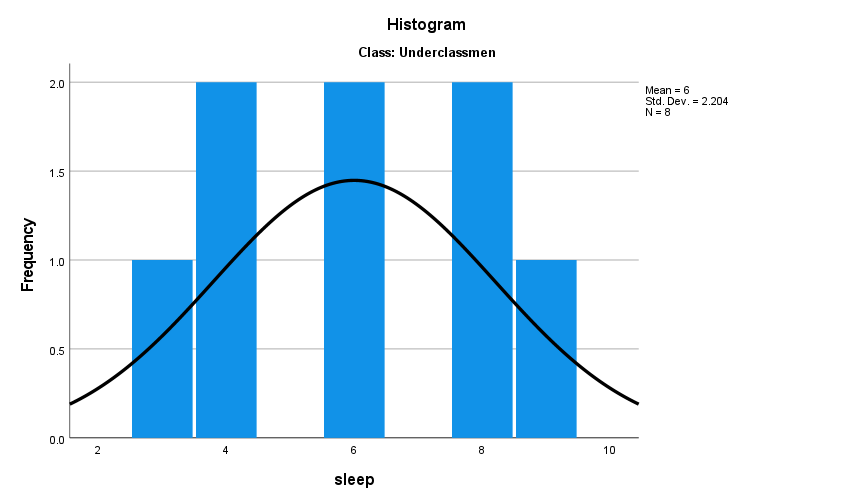

Histogram Class: Underclassmen Mean = std Dev 10 sleep = 2 204
Step by Step Solution
There are 3 Steps involved in it
1 Expert Approved Answer
Step: 1 Unlock

Question Has Been Solved by an Expert!
Get step-by-step solutions from verified subject matter experts
Step: 2 Unlock
Step: 3 Unlock