

Question: Name : ZiggY N/ Hour: |9t Graph the relationship between a choice and its opportunity cost Suppose you have a total of 20 hours of
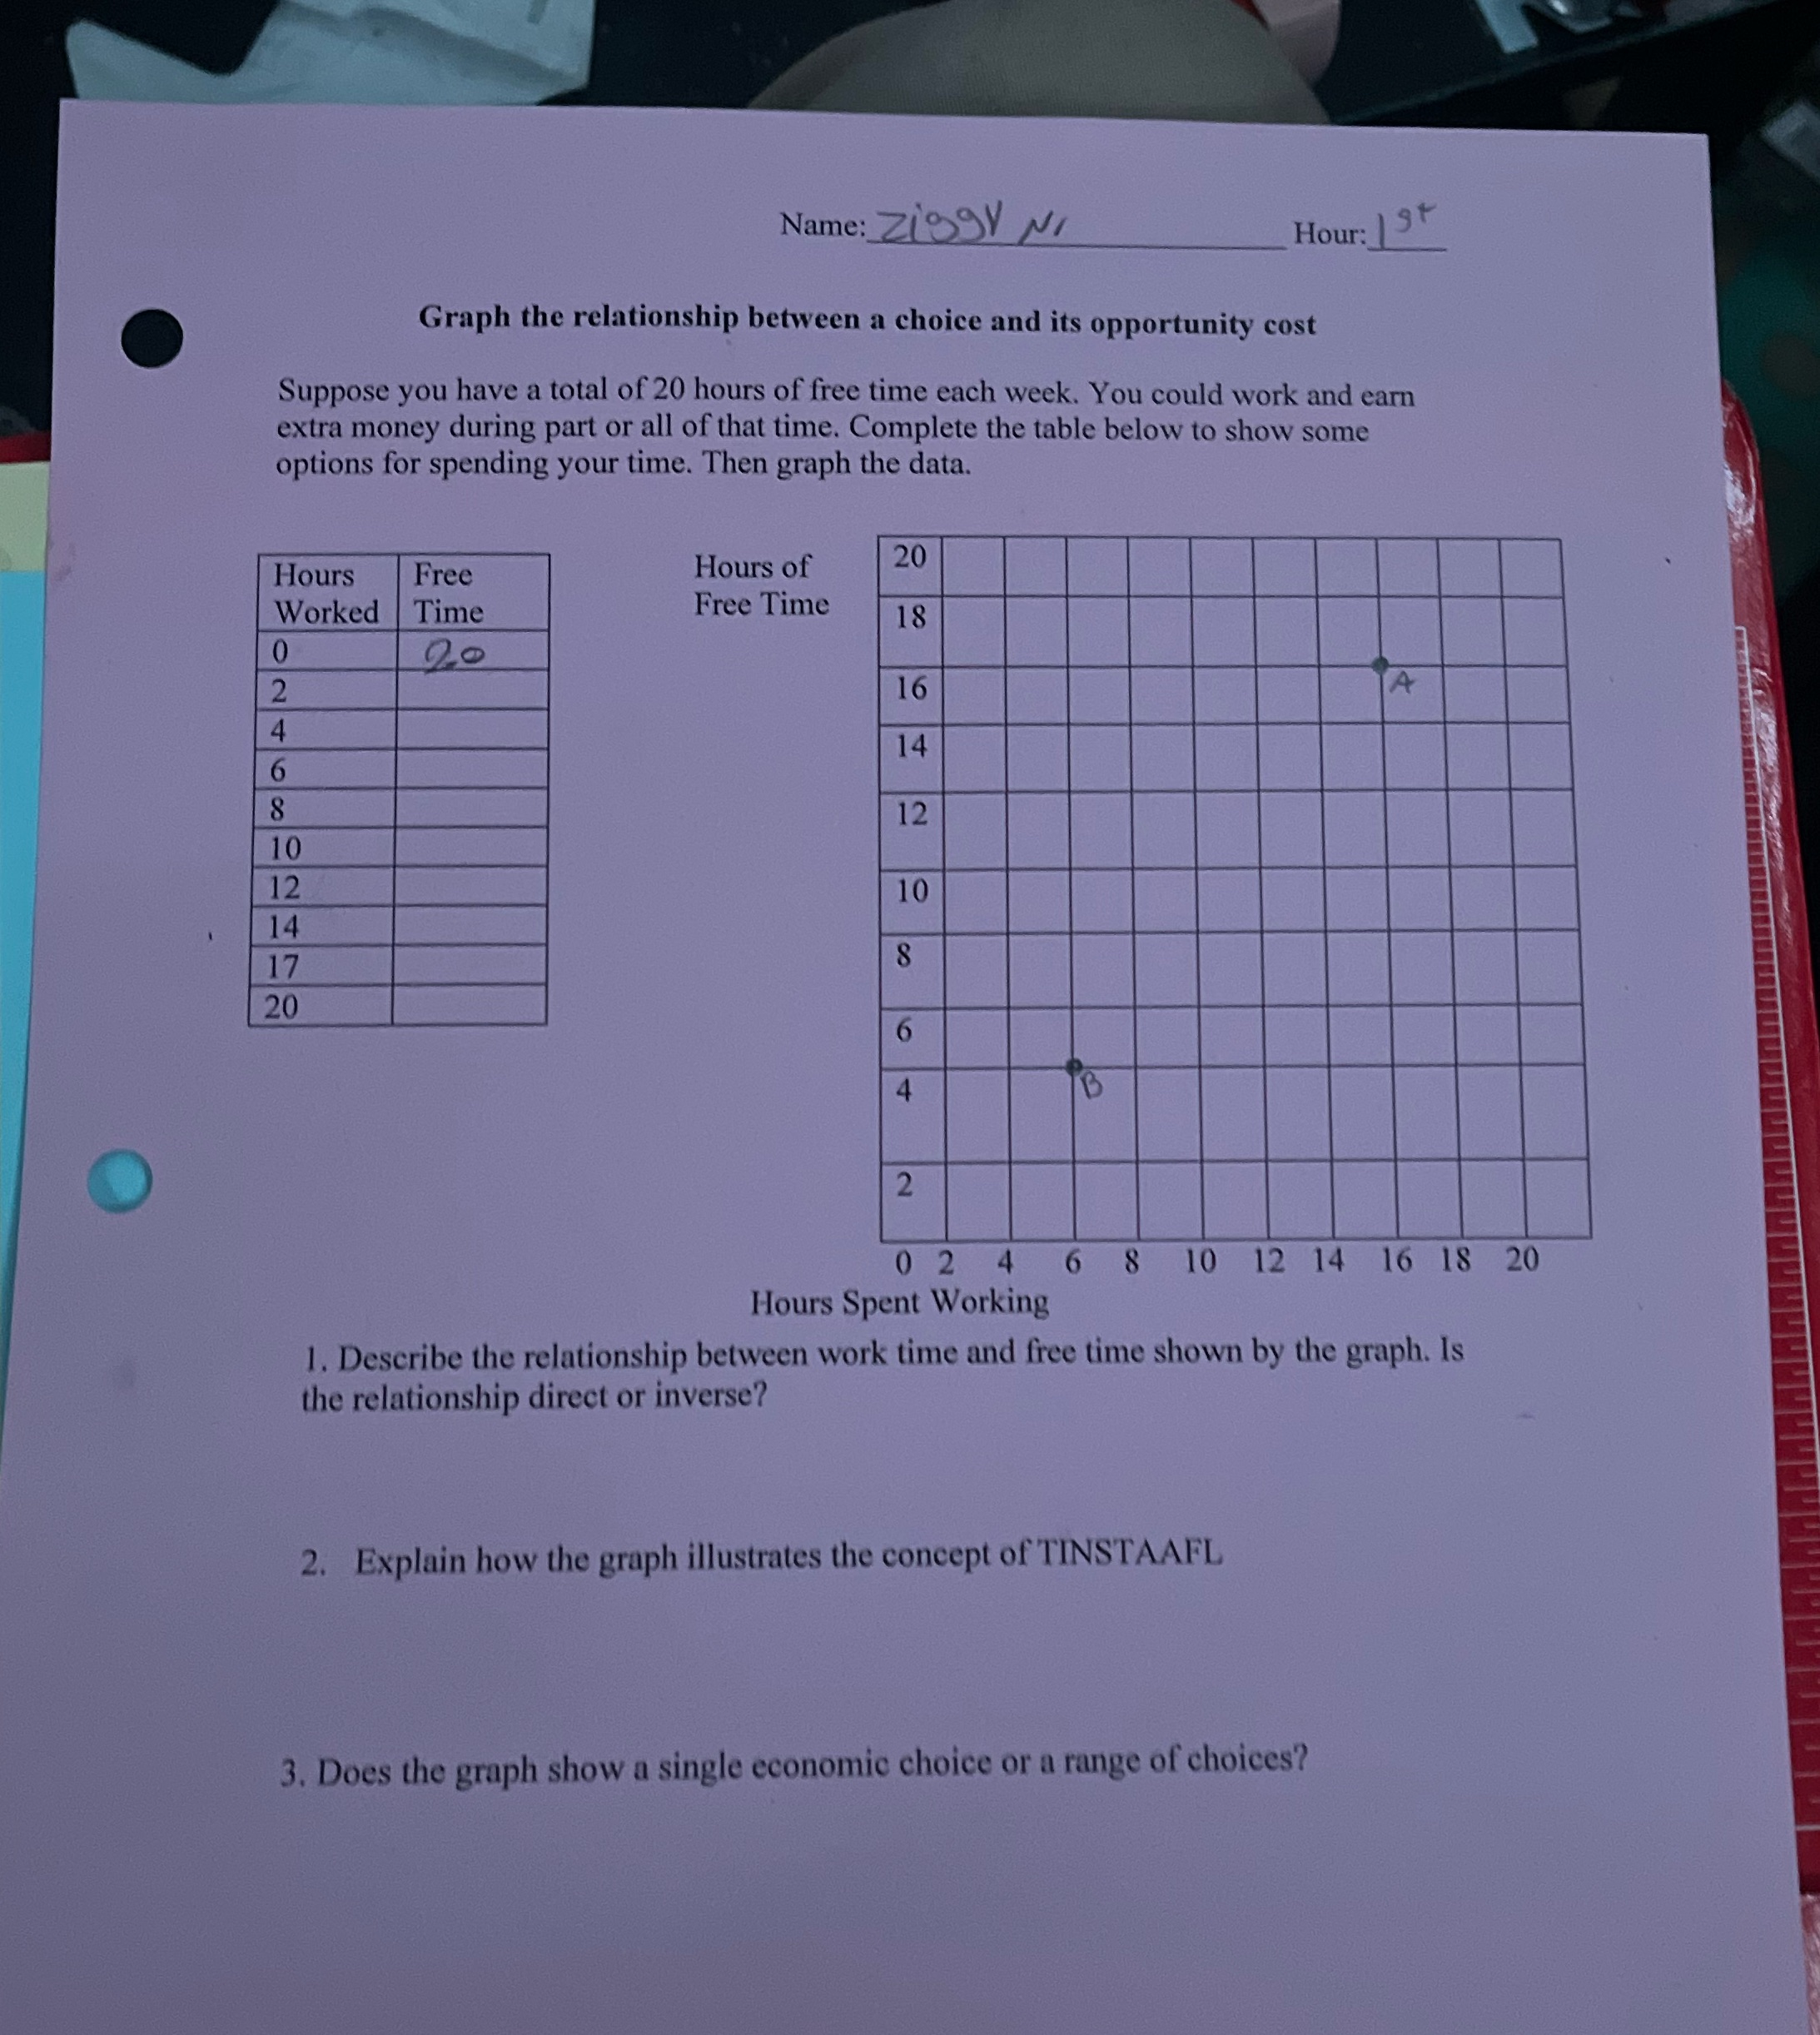

Name : ZiggY N/ Hour: |9t Graph the relationship between a choice and its opportunity cost Suppose you have a total of 20 hours of free time each week. You could work and earn extra money during part or all of that time. Complete the table below to show some options for spending your time. Then graph the data. Hours Free Hours of 20 Worked Time Free Time 18 2 16 4 14 6 8 12 10 12 10 14 17 8 20 4 B 2 0 2 4 6 8 10 12 14 16 18 20 Hours Spent Working 1. Describe the relationship between work time and free time shown by the graph. Is the relationship direct or inverse? 2. Explain how the graph illustrates the concept of TINSTAAFL 3. Does the graph show a single economic choice or a range of choices
Step by Step Solution
There are 3 Steps involved in it

Get step-by-step solutions from verified subject matter experts